Who funds the US lifestyle
July 9, 2023 -weekly comment
*******************************
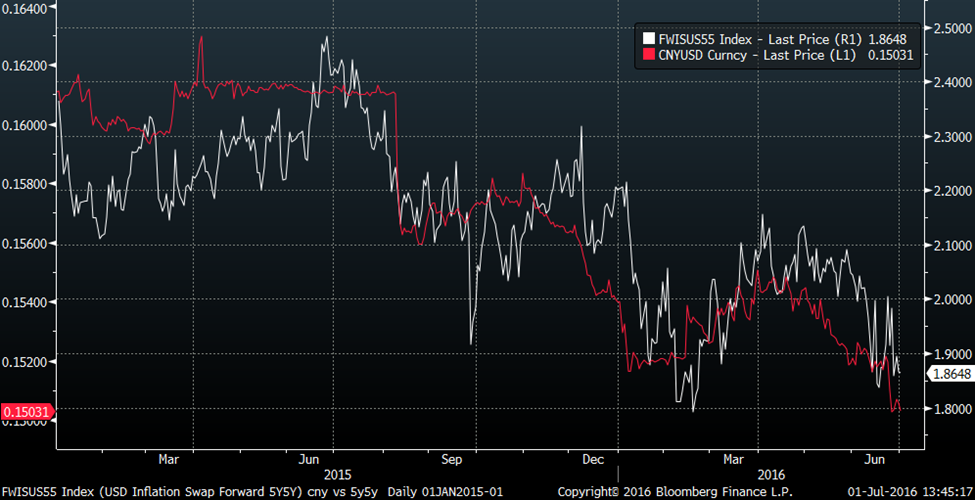
I had created a chart in 2016, with the US 5y5y inflation swap overlaid with China yuan (below). At that time a familiar refrain, especially after China devalued in 2015, was that China was exporting deflation. Indeed, depreciation in the Chinese currency appeared to be correlated to decreasing inflation expectations. There was much hand-wringing in the US related to the scourge of decelerating prices.
I updated and modified the chart (below) using the ten-year treasury/tip breakeven and adding the Japanese yen. From 2012 to 2015 the yen depreciated from 78 to 125. From the start of 2014 to the end of 2016 the yuan depreciated from 6.00 to 6.95. The ten-yr breakeven went from above 2.5% in 2013 to sub 1.5% in 2015-2016. In the chart CNY and JPY are inverted.
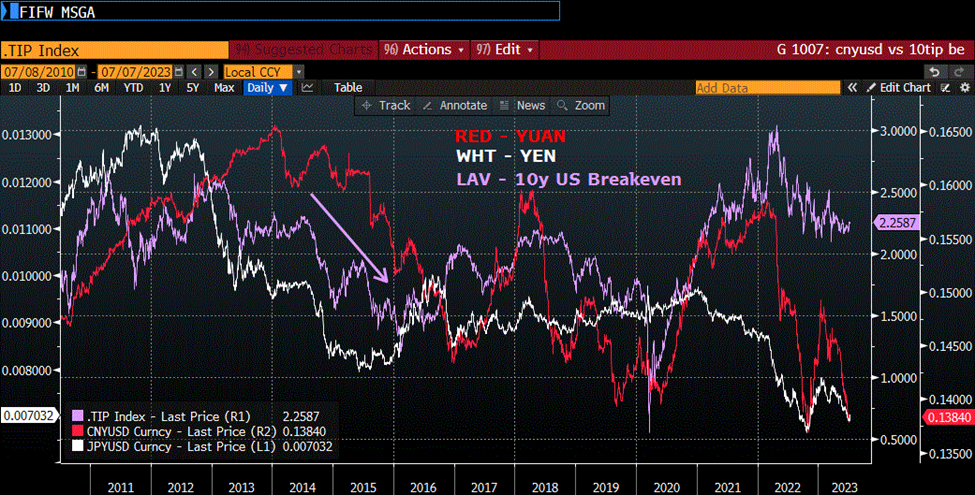
In recent history the yen has depreciated from nearly 100 at the start of 2021 to 150 in late 2022, now 142. Yuan started 2022 around 6.32 and is now 7.22. The ten-yr breakeven has gone from 3% to 2.25%. I’m not sure whether USD will continue its relative strength. In fact, on Friday $/yen had a fairly large counter-trend move, ending the week at 142.21 from over 145 to start the month of July.
Many have postulated that the BOJ might find it necessary to change policy, though Ueda seems to be in no hurry. Japan’s 2y note has a yield of -5 bps, and the 10y which is currently capped by policy at 50 bps, ended the week at 42 bps. Japan’s headline inflation is 3.2%. Renewed strength in the yen would likely be rather problematic for many global trades dependent on borrowing yen at 0% to deploy in higher yielding assets. Friday’s yen bounce bears watching.
An additional thought to bring into the mix was sparked by yet another excellent Doomberg article.
https://doomberg.substack.com/
The piece starts by noting the US is limiting sales of advanced semiconductor chips to China, with China responding by restricting exports of gallium and germanium. According to google China produces 90% of the former and 60% of the latter. The question posed is, which end of the spectrum creates more economic dominance, sophisticated final stage production or critical inputs? China wants both.
Whether done fairly or unfairly, China’s appropriation of intellectual property for complex manufacturing processes has expanded the nation’s power. The example Doomberg uses is BYD Auto, which “…has exploded into the top-selling EV maker in the world. Recent developments indicate an intent to press its many advantages beyond China’s borders.” This company sells more units globally than Tesla. Its new Seagull model starts at $11,300 according to Reuters. Nikkei Asia reports from Shanghai that “Sixteen automakers – including BYD, Telsa, and Chinese state-owned companies that have formed joint ventures locally with major Japanese, US and European automakers – on Thursday agreed to avoid excessive competition in the Chinese market, including ‘abnormal pricing.’”
I’ll tell you right now what’s “ABNORMAL” and that’s this clip from ZH:
Edmunds’ second-quarter vehicle transaction data shows that 17.1% of [US] consumers who financed a new car signed on for four-figure [> $1000] monthly payments. This now stands at a record high, up from 12.2% a year earlier. Before Covid, the figure was around 4.3%.

BYD Seagull
The old economic model was ‘vendor financing’ where the US bought manufactured goods from China, and China bought US bonds. Yellen’s visit rekindles hopes of a return to that model. Recently the US bond market has become more turbulent as the Fed hammers home a message of high rates for longer. This week’s ADP surge of 497k was partially offset by weaker than expected NFP of 209k, but yields still closed at the highs.
The five year yield ended the week at 4.333% (+20.5 bps) with 10’s at 4.046% (+23 bps) and 30s at 4.031% (+18). FV futures open interest is at a record 5.2 million, having been around 3.2m in late 2020. TY hit record open interest of 4.9m in May and ended the week at 4.8m. The hedgers have embraced the futures market as 10y yields surged from 3.4% in May. The five-yr yield is only about 8 bps from last year’s high 4.446% and 10s made a new high for this calendar year and now stand less than 20 bps below last year’s high of 4.245%. BBG notes heavy outflows from credit ETFs HYG and LQD with $1.13b withdrawn from the $13b HYG and $760m from the $35b LQD.
As the US Treasury auctions $40b in 3s, $32b 10s and $18b 30s this week, the question of demand becomes paramount. Funding rates exceed yields. On the SOFR curve, SFRZ4, a year and a half from now, is the first contract with a yield below the 5y, i.e. positive carry. SFRZ4 is 9584.5 or 4.155% with 5s at 4.33%. SFRH5 at 9604.5 or 3.955% is the first contract below the 10y yield. Sure, you can use Japan’s rates for funding…for how long?
CPI on Wednesday is the big data release for the week, expected to decline to 3.1% yoy mostly due to base effects, with Core 4.9 to 5.0 from 5.3 last. (CPI will be below Japan’s inflation rate). Barr, Daly, Mester and Bostic speak Monday and are all likely to lean hawkishly. Mester has always favored monetary restraint, Daly is squarely in Powell’s camp, and Bostic seems to be toeing the party line since his regulatory issues surfaced. Barkin and Kashkari on Wed, Waller on Thursday.
| 6/30/2023 | 7/7/2023 | chg | ||
| UST 2Y | 487.2 | 492.9 | 5.7 | |
| UST 5Y | 412.8 | 433.3 | 20.5 | |
| UST 10Y | 381.5 | 404.6 | 23.1 | |
| UST 30Y | 385.2 | 403.1 | 17.9 | |
| GERM 2Y | 319.6 | 325.3 | 5.7 | |
| GERM 10Y | 239.2 | 263.7 | 24.5 | |
| JPN 30Y | 123.5 | 126.8 | 3.3 | |
| CHINA 10Y | 264.0 | 264.3 | 0.3 | |
| SOFR U3/U4 | -103.0 | -96.0 | 7.0 | |
| SOFR U4/U5 | -83.0 | -66.5 | 16.5 | |
| SOFR U5/U6 | -21.0 | -14.0 | 7.0 | |
| EUR | 109.13 | 109.70 | 0.57 | |
| CRUDE (CLQ3) | 70.64 | 73.86 | 3.22 | |
| SPX | 4450.38 | 4398.95 | -51.43 | -1.2% |
| VIX | 13.59 | 14.83 | 1.24 | |

