What if the Fed hikes, but debt-limit issues spark a stock sell-off
April 23, 2023
With every mistake, we must surely be learning
Still my guitar gently weeps.
-The Beatles, 1968 White Album
The thirty year bond range on the year is 3.54%, the low on Jan 18, to 399.5% for a high on March 2. Friday I marked the 30y yield at 3.776%, essentially right in the middle of the year’s range. No particular edge at this location. The range in tens is 3.37% in Jan to 4.06% on March 2, with Friday’s close nearer the low end at 3.572%. The five year low to high is 3.376% (just after SVB) to 4.35% on March 8. Last is 3.665%. In the month of March, 5/30 made the entire range for the year so far: -45.8 on March 8 to +25.5 on March 23. Current is +11. Looking at the back end of the SOFR curve, the low price (high yield) for the June’26 one-yr pack was 9649 on March 2 (3.51%) and the June’27 pack low on March 2 was 9647 (3.53%). Friday’s settles were 9696.75 and 9685.875. (A pack is the average of the four contract prices).
With stronger than expected data in February, starting with the booming NFP (472k) on Feb 3, rates soared higher going into the beginning of March, but back-month SOFR contracts never rose above levels that would be consistent with 3.25-3.50% FF target. Current levels are consistent with 3%. The market has consistently associated near-term tightening with conditions that will lead to lower rates in a couple of years.
At the very front end of the market, FFK3 settled 9496.5 on Friday, pricing near certainty of a 25 bp hike at the May 3 FOMC. FFM3 settled 9491.0 or 5.09%, essentially right at what should be the new Fed Effective of 5.08%. On Friday, PCE prices are released, with the headline number expected 4.1% from 5.0% last and Core expected 4.5% vs 4.6% last. If headline yoy is 4.1% and the Fed hikes on May 3, then the Fed Effective will be approximately 1% higher than inflation.
The market clearly perceives the next hike as being the last one, with a small chance of another hike at the June 14 meeting. Again, the more important quality for Fed policy going forward is to try to convince investors that a pivot will NOT come this year. FFF4 settled Friday at 9541.5 or 4.585% essentially ½% below what will likely be the Fed Effective as of May 4. What is interesting about the FFF4 contract is that it traded just over 5.5% at the start of March with a low of 9444, and traded just under 3.5% on the SVB turmoil, notching a high of 9663.5 on March 15.
My personal feeling is that the Fed gains nothing by hiking at the May meeting, and rather should hold fire, but strongly emphasize the threat of additional rates hike over subsequent meetings. One consideration may be that the critical debt ceiling date has been moved forward to June as tax collections were not as robust as expected.
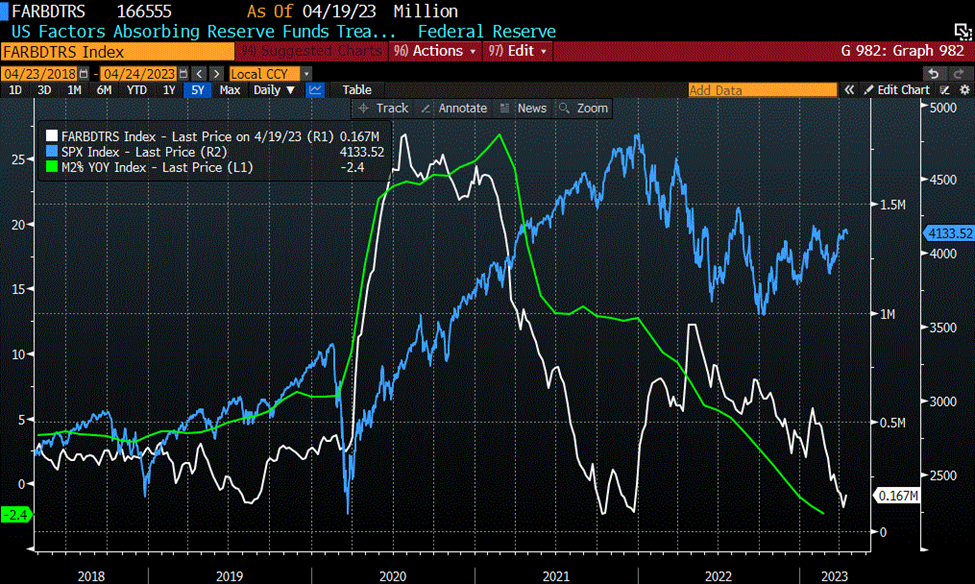
The Market Huddle podcast (Kevin Muir and Patrick Ceresna) had a guest named Vincent Deluard from StoneX Group this weekend. One important topic was the Treasury General Account (TGA) and how it is currently extremely low at about $160 billion due to the debt-ceiling impasse. Deluard noted that there’s an inverse relation between the TGA and stocks, saying that the re-build of TGA in early 2022 was very well correlated with the decline in stocks, and that when the government DOES replenish the TGA, it tends to suck liquidity from markets, especially the higher risk categories.
Deluard said the TGA normally has enough for about one month of expenditures, but currently has less than two weeks as a balance. Not only that, but of course the deficit continues to grow, expected to be about $630 billion this year.
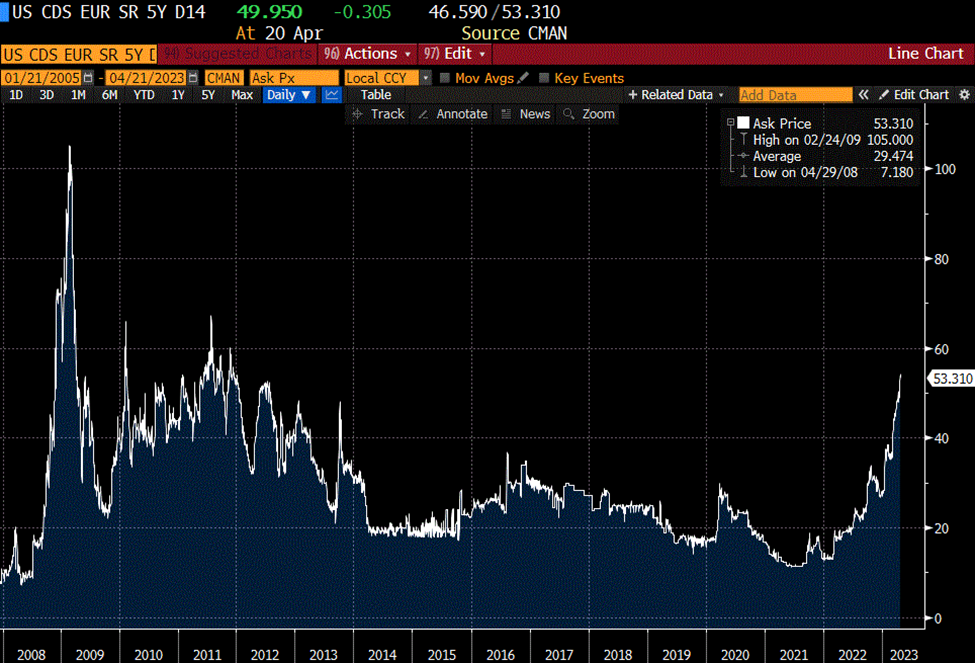
Imagine this scenario: Economic data this week comes in about as expected. On May 3 the Fed hikes, but the debt ceiling impasse becomes more and more contentious as the deadline moves ever closer. For evidence that this is already occurring to a degree, note that US 5y CDS went to 53 bps at the end of last week, the highest since 2012. Implied vol in near SOFR contracts had declined as banking problems appear to have abated, but vols firmed into the end of the week, another small sign of uncertainty.
Imagine that this week’s auctions of 2, 5 and 7 year notes don’t go as well as expected due to issues having to do with the debt-limit. The market realizes that the TGA will need to be built up rapidly and, as a result, stocks encounter a hard sell off.
If this type of action should unfold, the blame will of course go directly to the Fed for over-tightening. The easing narrative will thus be brought forward, and it will become even more difficult for Powell to lean against a pivot. A pause in May could forestall the criticism.
If the Fed pauses, then further steepening of 5/30 could result. The thirty-year bond yield could easily approach the upper end of the year’s range at 4%.
Below are charts: The top one is SPX in blue, the TGA in white (last at $167b), and M2 yoy percent change in green. Note that the CBO projects 2023 Fed’l Gov’t outlays at $6.2 trillion, approximately $500 billion per month and 23.7% of GDP.
The second chart is US 5yr CDS.
| 4/14/2023 | 4/21/2023 | chg | ||
| UST 2Y | 409.0 | 418.8 | 9.8 | wi 414.5/413.5 |
| UST 5Y | 360.4 | 366.5 | 6.1 | wi 365.5/365.0 |
| UST 10Y | 351.7 | 357.2 | 5.5 | |
| UST 30Y | 373.6 | 377.6 | 4.0 | |
| GERM 2Y | 288.1 | 292.0 | 3.9 | |
| GERM 10Y | 244.0 | 248.1 | 4.1 | |
| JPN 30Y | 130.0 | 134.1 | 4.1 | |
| CHINA 10Y | 283.0 | 282.9 | -0.1 | |
| SOFR M3/M4 | -148.0 | -145.0 | 3.0 | |
| SOFR M4/M5 | -56.5 | -62.5 | -6.0 | |
| SOFR M5/M6 | -2.0 | -2.0 | 0.0 | |
| EUR | 109.97 | 109.92 | -0.05 | |
| CRUDE (CLM3) | 82.43 | 77.87 | -4.56 | |
| SPX | 4137.64 | 4133.52 | -4.12 | -0.1% |
| VIX | 17.07 | 16.77 | -0.30 | |
https://www.cbo.gov/publication/58946
Market Huddle

