Vol hit, but the range of economic outcomes is wide
January 26, 2025 -Weekly comment
**************************************
A lot of it comes down to whether or not you think the new administration will be successful in changing the trajectory of government spending relative to GDP. If you believe that, and I do, then the long-end of the market will become less concerned about forward deficits driving yields higher. Over time, that should reduce term premium. In the short run, it’s about inflation and whether the private sector smoothly absorbs the impact of lowered government support. Open question.
This week the FOMC meets. As BofA CEO Brian Moynihan said, when asked in an interview with Brian Sozzi, about the possibility that the next Fed move could be a hike, “…we have a new administration, a new set of fiscal policies, and monetary policy has to respond to that.” He cautiously added that consumers are currently spending at a level consistent with 2% inflation and 2% growth, and we have to be careful about raising rates on small to medium sized businesses.
https://finance.yahoo.com/video/trump-2-0-great-news-120027063.html
For the Fed, the inflation mandate is again the dominant concern. In both the September and December meetings, there was one dissenter. In Sept, Bowman preferred a cut of only 25 bps and in Dec, Hammack preferred no cut. The market voted by raising forward rates. At this week’s meeting, there is little drama. The current EFFR is 4.33% and February Fed Funds settled right on top of that at 9567.5. No ease expected. However, April Fed Funds, which reflect the odds of a move at the March 19 FOMC, settled 9574.0 or 4.26%; about 28% chance of a 25 bp ease. The peak contract on the FF curve is July’26 at 9610.0 or 3.90%, while the peak SOFR contract is SFRH6 at 9604.0 (3.96%). The highest print since the Dec FOMC has been 9610.5 in SFRH6. Similarly, the highest in FFN6 has been 9613.5. These prices are consistent with a FF target of 3.75/4.0 and Fed Effective of 3.83%. For now, the market is penciling in another 50 bps of cuts, with little sense of urgency.
However, short end futures prices continue to build in a premium for the unknown economic shock that could be lurking around the corner. For example, on Friday there was a seller of about 10k SFRN5 9562.5/9637.5 strangles from 14 to 13.5. Reasonable trade. The underlying contract SFRU5 settled 9600. SFRM5 settled 9591.5, a spread of -8.5. So the roll implies U5 should ease lower by about 3 bps per month. However, settles were as follow: SFRN5 9562.5p 4.5 and 9637.5c 9.0. The equidistant otm call is worth twice as much as the put. Even though there’s recently been talk of possible rate HIKES, the idea is that there would be time to respond; a shift towards hike wouldn’t likely be a shock, but rather a process. The failure of SVB and even the yen-carry unwind of last August reveal a much different dynamic, bordering on panic, for the upside.
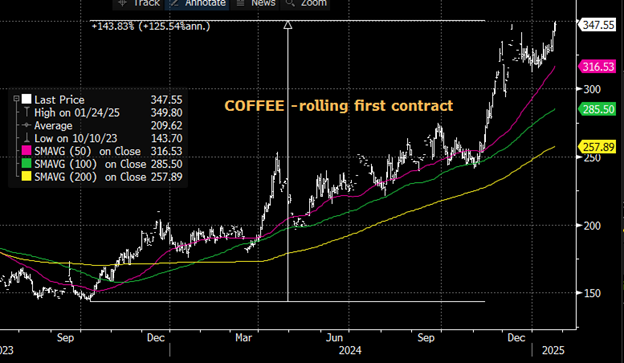
By the way, DOGE has mandated ‘no coffee’ at the FOMC meeting. “Put the coffee down. Coffee is for closers.” Not exactly bitcoin, but it has doubled over the past year. Joking of course, but this isn’t the type of price action that would tend to cap inflationary expectations.
In terms of Bernie Sanders (and Trump) talking about capping credit card rates at 10%, the below chart is from the St Louis Fed. Credit card rates are currently around 22% and the 60 month new auto loan at around 7.5%. Even when Fed Funds were zero, credit card rates never fell below 12%.
Non-starter.
Below is just a brief discussion of TY open interest and some specific trades.
TYH5 108.5c now have 197k in open interest (up 53k Friday and the peak OI of any option in TY), followed by 109c with 92k. Futures open interest in TY is 4.832m, also up 52k. On December 20, just after the last FOMC, OI was 4.434m, so in just over one month, TY futures have added 398k contracts, or about 9%, nearly $40 billion notional. Historically large? Not really, we had the same sort of increase from Dec 8, 2022 to Feb 1, 2023. So perhaps there’s not a lot to read into it. On the other hand, we had a large increase from 6/21/24 (4.29m) to 7/29/24 (4.72m), but what followed next was that both open interest and the TY price exploded higher on the yen-carry debacle of late July to August 5, peaking at 5.51m in late August just prior to the TYU4 option expiration. The question, of course, is whether this particular build-up means anything. In the beginning of 2024 tens sold off. Mid-year was the yen related rally. What is interesting about now is that a big part of the open interest rise has been driven by a buyer of covered calls.

On Friday, a buyer of 50k TYH5 108.5c 0’41 covered 108-11 with 47 delta, synthetic 1’28 in 108.5^. This is an add. On Jan 14, Tuesday, he bought about 100k TYH5 108.5c ’28 covered average 107-10, 30d. On Wednesday Jan 15, there was a buyer of 40k TYH5 109c 0’35 covered 108-09, 36d.
Vol imploded this past week. MOVE index went from 95.60 to 86.75. On Friday, Jan 17 I marked TYH5 108.5^ at 1’43 vs 108-17+, or 6.5%. Friday Jan 24, TYH5 108.5^ settled 1’26 vs 108-15, or 6.1. Obviously muted price action in futures was a factor in last week’s vol slide. Are these protective trades, or is something on the horizon? Certainly, the initial buys weren’t great timing in terms of vol. Bears watching.
Monday New Home Sales
Tuesday Durables and Consumer Confidence
Wednesday FOMC
Thursday Q4 GDP and Jobless Claims
Friday PCE prices with yoy expected 2.5% from 2.4% and Core yoy 2.8% from 2.8%.
Auctions of 2, 5 and 7 year notes are front-loaded into Monday and Tuesday.
OTHER THOUGHTS
Given auctions at the start of the week, followed by the FOMC, I would expect a bit of a concession in the front end. Probably no more than a few bps, but the press conference is likely to lean to the hawkish side. While new tenant rents have been trending lower (possibly a leading indicator for CPI) the last U of Mich inflation expectations data were concerning. The one-year forward number hit a low of 2.6 on Nov 30, but is last at 3.3. The 5-10yr forward expectation is at its high of 3.2%. Finally, the ten-year treasury to tip breakeven is 242 bps, near the top of the range for since 2023.
| 1/17/2025 | 1/24/2025 | chg | ||
| UST 2Y | 427.0 | 426.6 | -0.4 | wi 426.9 |
| UST 5Y | 441.5 | 442.6 | 1.1 | wi 442.8 |
| UST 10Y | 460.9 | 462.1 | 1.2 | |
| UST 30Y | 484.4 | 484.7 | 0.3 | |
| GERM 2Y | 222.9 | 229.0 | 6.1 | |
| GERM 10Y | 253.5 | 256.9 | 3.4 | |
| JPN 20Y | 191.0 | 190.0 | -1.0 | |
| CHINA 10Y | 166.1 | 166.4 | 0.3 | |
| SOFR H5/H6 | -24.0 | -26.0 | -2.0 | |
| SOFR H6/H7 | 5.5 | 7.5 | 2.0 | |
| SOFR H7/H8 | 6.5 | 8.0 | 1.5 | |
| EUR | 102.76 | 105.04 | 2.28 | |
| CRUDE (CLH5) | 77.39 | 74.66 | -2.73 | |
| SPX | 5996.66 | 6101.24 | 104.58 | 1.7% |
| VIX | 15.97 | 14.85 | -1.12 | |
| MOVE | 95.60 | 86,75 | -8.85 | |

