Uncapitalism
December 6, 2020 – Weekly comment
“Corporate bonds now yield less than inflation expectations for the first time in history” -Dec 2 Tweet from Otavio Costa
“You cannot have capitalism if you don’t have a hurdle rate for investment.” -Stanley Druckenmiller
There were two big themes in US interest rate futures trading this week. On the micro/regulatory side there was a change in guidance regarding the switch from LIBOR to SOFR. On the macro side, the curve powered to new highs for the year. Rather than plow through ARRC language on recommended fallbacks, I am just going to lightly summarize market reaction to the extension of libor to June 2023. With respect to the curve, I will attempt to touch upon the broader macro themes in the context of the quotes at the top of this note.
On Monday, November 30, the ICE Benchmark Admin and the Fed announced that 3-month libor will continue being published through June 2023. Rather than attempt to parse through the minutiae I will just note changes in spreads on the ED curve. From late September to early November, EDZ’21/EDH’22 calendar spread rallied from -1.0 to +7.0, as the end of 2021 was expected to trigger libor fallback provisions. Throughout that period, EDU’21/EDZ’21 stayed between 2 and 3.5, while EDH’22/EDM’22 traded between 0.5 and 2.0. I.e. the 3-month spreads surrounding Dec1/March1 barely moved; the market was clearly pricing a specific libor/sofr transition. With this week’s announcement that 3m libor would continue until June 2023, EDZ’21/EDH’22 instantly reverted to its former value of negative 1.0. Change on week +4.0 to -1.0. However, the extension to June’23 caused EDM’23/EDU’23 to explode higher, from +4.0 to +14.0 (settled 13.5). Again, the surrounding spreads were relatively quiet: EDH’23/EDM’23 has been between 2 and 5.5 since October, and EDU’23/EDZ’23 between 4.5 and 7.0. These calendar moves appear to be one-off adjustments. The Z1/H2 spread had rallied 8 (-1 to +7.0) and, as it reverted back, the M3/U3 jumped 10 (+4 to +14). Why the extra 2 bps? Because the first period is covered by the Fed promise to hold rates at zero, and out in 2023 that vow is much less certain; the general steepening of the curve is being increasingly reflected in deferred ED contracts.
In terms of curve steepening, all measures made new highs for the year: 2/10 ended the week up 12.5 bps at 81.5. This is interestingly exactly at the 0.618 retracement from the high of 135.5 made in late 2016 in the aftermath of Trump’s election victory, to the low of -5.3 set in August 2019. 5/30 ended the week at 131. This is much closer to the 2016 high of 139.5, and is right around the 0.382 retrace from the Nov 2010 high of 304 to the Aug 2019 low of 20. Next objective should be 160 to 165. On the euro$ curve, the red/gold pack spread (2nd year forward to 5th year forward) closed at 69.75. This spread too, had surged post-2016 election, from 40 in September to 101.5 in December’16. It had inverted at the low in 2018 to -5.6 as the Fed pursued its ‘normalization’ quest. From a longer term perspective, at the very end of 2013 red/gold had traded above 300 bps, equaling the level of 5/30 at its high.
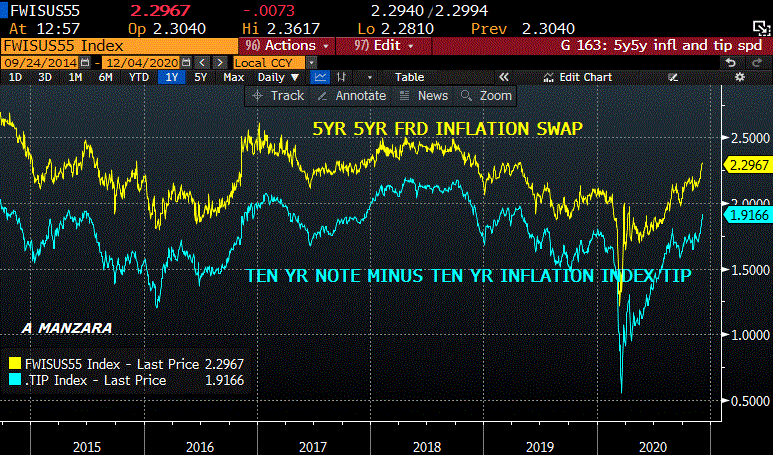
The Fed’s continued oath to keep rates at zero along with hints of an expansion of bond buying, coupled with the prospect of more fiscal stimulus is helping to push stocks up and the dollar down (DXY new low this week 90.80). It’s unsurprising that the yield curve would steepen in this environment: the Fed is doing all it can to generate inflation which detracts from the value of longer dated fixed income contracts. Consider the long term chart below showing proxies for inflationary expectations, the ten year tip breakeven and the five-yr five-yr forward inflation swap. Both are at new highs for the year at 191.5 and 229.5, and both within about 30 bps of 2018 highs, when FF were 1.50 to 2.0% and 10’s were 2.80 to 3.0%.

Now let’s consider the quote from the top of this note, that corporate bonds yield less than inflation expectations for the first time in history. What are the ramifications of THAT?! First, the author uses the ten year note to inflation indexed spread (shown above at 191.5) and then uses Barclays US Agg Corp Yield to Worst (LUACYW <index>) at 185.0. I checked the St Louis Fed (FRED) website for Moody’s Seasoned Aaa corp bond yield and it’s 221; the ICE BBB US Corp Index effective yield is 213.
No matter. If a company can borrow at a cost below inflation, and if inflation is expected to rise, causing all prices and inputs except interest rates to (theoretically) rise at the same rate, then there is a compelling argument to engage in financial engineering. A lot of it. There is no cap on asset prices. The investment “hurdle rate” is just a figment of Druckenmiller’s imagination. The underpinnings of capitalism are dissolved. Of course, this state of affairs doesn’t support the value of the US dollar because the “store of value” aspect of the currency is viewed with increasing suspicion.
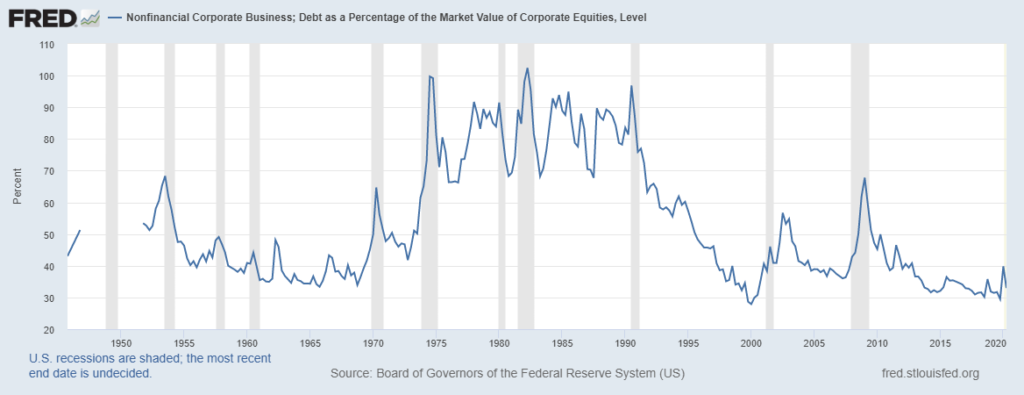
The Fed, of course, keeps warning about economic risks to the downside (and implicitly deflationary pressure) as it counsels for more fiscal stimulus. Companies have feasted on the gift of low funding rates as the market eyes forward inflation. However, the chart below shows that Nonfinancial Corporate Business debt as a percentage of the market value of corporate equities is at the historically modest level of 33%. In my mind, given that investment grade debt is mostly rated BBB, this level is more suggestive of overvalued equities than low healthy debt levels that would allow for productive expansion. As a percentage of GDP, corporate debt is at a record high. However there’s an alluring siren call to borrow given lofty equity prices. It’s all good. Until it comes time to roll the debt over.

On the government side, debt expands relentlessly. According to Beth Stanton at BBG, this week’s treasury auctions include $56 billion 3’s, $38b 10’s and $24b 30’s (last two are re-openings).
This Thursday’s CPI report probably won’t indicate price pressures. Core yoy expected +1.6, same as last. Fed’s Z.1 report is also released Thursday.
OTHER MARKET THOUGHTS/ TRADES
This week featured a large option roll in Blue March midcurves. Buyer of over 100k 3EH 9925/9912 put spread vs sell 3EH 9962/9975 call spread for 1.5 ref EDH’24 9946.0. The original trade from mid-Oct was buying 3EH 9912/9900ps vs 9975/9987cs for 0.25 to 0.5. Versus Friday’s settle of 9936.0 in EDH’24, the 9925/9900ps settled 4.5 and the 9962/9987cs settled 1.0. The top strike of the put spread is now just 11 bps away, and the trade has been helped by the libor extension and steeper curve. The US ten year note ended the week at 96.6; the 1% yield level is viewed as psychological resistance.
Because of the libor extension, contracts from EDU’23 back broke hard in relation to contracts just in front. For example, EDM2/EDM3 settled 13.0, up 3 on the week, while EDU2/EDU3 settled 24.5, up 12 on the week. The green/blue pack spread (Z2, H3, M3, U3 vs Z3, H4, M4. U4) is now the highest one-year spread area on the ED curve at 28.25 bps. Red/green is 13.75 and blue/gold is 27.75. The peak one-year calendar is EDM3/EDM4 which settled 32, just a little bit greater than one 25 bp fed hike.
On the treasury curve, there has been a decent amount of open interest build in Feb 136 and 136.5 puts which now comprise the largest open interest in Feb options at 67k and 63k. Some of these buys were rolls from higher Jan put strikes. Feb options expire Jan 22, just two days after the inauguration. With TYH1 having settled 137-12, the 136.5 strike represents a cash yield of around 1.06% given a parallel shift. The Jan 137p still has 108k of OI, the largest of any TY put option. It settled 17/64 and expires 24-Dec. Cash equivalent is just above 1% with breakeven around 1.05%.
December midcurves expire Friday. For the first time in a while, the Blue expiring midcurve straddle was mispriced. At the start of the week it was 5.5 offer and on Friday the contract settled 9942.0 with the straddle 9.0.
| 11/27/2020 | 12/4/2020 | chg | ||
| UST 2Y | 15.2 | 15.1 | -0.1 | |
| UST 5Y | 36.7 | 42.1 | 5.4 | |
| UST 10Y | 84.1 | 96.6 | 12.5 | |
| UST 30Y | 157.4 | 172.9 | 15.5 | |
| GERM 2Y | -75.5 | -74.7 | 0.8 | |
| GERM 10Y | -58.8 | -54.7 | 4.1 | |
| JPN 30Y | 64.8 | 65.0 | 0.2 | |
| EURO$ H1/H2 | 7.5 | 3.5 | -4.0 | |
| EURO$ H2/H3 | 7.5 | 9.5 | 2.0 | |
| EURO$ H3/H4 | 18.5 | 30.5 | 12.0 | |
| EUR | 119.61 | 121.21 | 1.60 | |
| CRUDE (active) | 45.53 | 46.26 | 0.73 | |
| SPX | 3638.35 | 3699.12 | 60.77 | 1.7% |
| VIX | 20.84 | 20.79 | -0.05 | |
https://twitter.com/TaviCosta/status/1334340659591827467/photo/1
https://www.thewealthadvisor.com/article/stanley-druckenmiller-couldnt-have-been-more-wrong
https://www.newyorkfed.org/medialibrary/Microsites/arrc/files/2019/LIBOR_Fallback_Language_Summary

