Treasury jitters
Oct 13, 2019 – Weekly Comment
Last Sunday, referring to the week ended 4-October, I wrote, “The two-year yield dropped over 23 bps… In my book, that’s an ease!” What a difference a week makes. Because this week, the market recaptured that ease, and then some. Usually in the table at bottom, I just note one week changes. But below, I show the past three Fridays (I mark treasury yields as of futures market settlements). The two year went from 1.622% on 27-Sept to 1.388% and back to 1.616%. A round turn. Tens from 1.675 to 1.507 to 1.755. That is a monumental move which suggests the first week of October was pure capitulation.
The two dominant events were the Fed announcing a $60 billion per month t-bill buying program and PHASE I of the China trade deal. The Fed wants everyone to think of this latest move as normal, everyday tweaking of the monetary levers to ensure smooth market functioning. We’ll get to that below.
The China deal is quite interesting in terms of strategy. The election is just over one year away. Every time the stock market goes up it’s due to “optimism on a trade deal” and every time it goes down it’s due to some sort of an impasse on a trade deal. It makes a tremendous amount of sense to dribble out the easy phases of agreement to string along equity participants and manage expectations. China was able to delay implementation of tariffs, and can likely wrangle more advantageous clauses as time goes on. In fact, though there was a reasonable amount of day to day movement, SPX for the past three Fridays was fairly constant: 2962, 2952, 2970. So, the giddy enthusiasm on Friday is somewhat tempered when looking at a slightly longer time frame.
On the yield side, the implications aren’t clear, but the market is giving strong clues. October Fed Funds on Friday closed +1.0 bp at 98.1775 or 1.8225%. Pretty much right on SOFR and the Fed Effective rate. In the very front part of the curve, the market has a high degree of confidence that the Fed will do whatever it takes to control repo. However, April 2020 Fed Funds dropped 10 bps on Friday from 98.655 to 98.555 or 1.445%. The 6-month spread between Oct FF and Apr FF is thus -37.75 with four FOMC meetings within the period, i.e. 1.5 expected cuts. It’s worth noting that January 2020 Fed Funds (which capture only 2 FOMCs) settled as high as 98.565 seven trading sessions ago. So 1.5 eases HAD BEEN priced for two meetings and has now been stretched to four meetings.
On the euro$ curve, it’s a similar story. The very front end of the curve is underpinned by the Fed’s efforts to supply liquidity. Back contracts took a tumble. As an example, EDZ9 fell 7 bps on the week, to 98.10. However, EDZ0 fell 29.5 to 98.45! Near calendars obviously made new highs, with EDZ9/Z0 up 22.5 to -35.0 and EDH0/EDH1 up 7.5 to -22.0. The absolute measure on EDH0/EDH1 suggests only one ease over that year. And of course, one-year calendar spreads from there forward are steady to positive. EDH1/EDH2 is essentially flat at -0.5 and EDH2/EDH3 is +6.0. The peak contract on the euro$ curve remains the eighth quarterly, now EDU21, at 98.545. The highest settle of the 8th contract was on Sept 4 at 98.945, which would be consistent with a FF target of 0.75 to 1.0%, rather than the current level which would suggest a target of 1.25%.
What about the immediate prospect of an Oct 30 cut? Although market dynamics have changed, I think the Fed will continue to err on the side of extra liquidity and ease by another 25 bps. This move had been substantially priced early in the week with Oct/Nov FF calendar around -19 bps. However, the spread closed Friday at -15.75, still suggesting an ease, but with less certainty. I think the Fed got a good scare out of the repo surge and can couch another ease in the context of low inflation expectations and somewhat soft data. As an example, the NY Fed’s UIG (Underlying Inflation Gauge) was released last week at 2.4%, having steadily declined from 3.1% in late 2018. The ten year treasury to inflation-indexed note spread has been anchored just above 150 bps.
The longer end of the curve may provide the true “tell” for action going forward. Often, treasuries rally when coming out of the third leg of the auctions. Not this time. While I think there is likely to be a brief bond market rally in the early part of the upcoming week, sentiment appears to have turned decidedly bearish. The globe has been easing monetary policy. The Fed is committed to liquidity. The administration will probably do whatever it takes to juice the economy going into the election. Implied vol firmed on the move down. I don’t perceive the bond market as being in a bubble, but it does seem as if long yields have a lot more room to the upside than downside. As recently as April the 30-year yield was near 3% and just under one year ago in November it was near 3.50%. (Friday close 2.216%) Also worth noting is that the ten-year German bund yield ended at -44 bps on Friday, a rise of 14 on the week and the highest since early August; a downward sloping trendline since April was violated.
Perhaps there aren’t a lot of people in
today’s market that recall this, but I remember a time when Greenspan fretted
that there might not be enough government debt to appropriately conduct
monetary policy. I looked up a Greenspan
speech from April 27, 2001 entitled ‘The Paydown of Federal Debt’. Below are a couple of excerpts (linked at
bottom):
Today I want to address a subject in which your group and the
Federal Reserve share a keen interest–the paydown of the federal debt and its
implications for the economy and financial markets. While the magnitudes of
future federal unified budget surpluses are uncertain, they are highly likely
to remain sizable for some time.
…current forecasts suggest that under a reasonably wide variety of possible tax and spending policies, the resulting surpluses will allow the Treasury debt held by the public to be paid off. [Wow, what a difference a couple of decades makes. 30-year auctions were actually suspended for a while]
The effectiveness of our markets in allocating capital is one of our nation’s most valuable assets. We need to be careful not to impair their functioning.
Given concerns about the potential distorting effects of asset accumulation by the Treasury or in government defined-benefit plans, we need to carefully consider the appropriate path of debt paydowns.
A final valuable feature of the Treasury market is that it is a remarkably efficient system for funding federal government deficits. Because demographic and other factors are surely likely to lead to the re-emergence of deficits in the future, one might argue that it would be best to continue to borrow at least limited amounts from time to time in order to keep the market operating, so that it will be available when it is needed again.
Currently, Treasury securities are the “permanent” assets that correspond to the currency that is the Federal Reserve’s main liability. Treasury securities have several features that make them particularly attractive assets for the Federal Reserve. First, the liquidity of the market allows the Federal Reserve to make substantial changes in reserves in a short period of time, if necessary. Second, the size of the market has meant that the effects of the Federal Reserve’s purchases on the prices of Treasury securities have been minimal. Third, Treasury securities are free of credit risk. Thus, the Federal Reserve does not itself take on such risk when it holds them. … we believe that the effects of Federal Reserve operations on the allocation of private capital are likely to be minimized when Federal Reserve intermediation involves primarily the substitution in the public’s portfolio of one type of instrument that is free of credit risk–currency–for another–Treasury securities. As I discussed earlier, it is important that government holdings of assets not distort the private allocation of capital, and this goal applies to the Federal Reserve System as well as to the Treasury.
Even before that time, the Treasury market may become less liquid, making it more difficult for the Fed to make purchases without affecting market prices. Moreover, declining Treasury debt presumably would, at some point, reduce the liquidity of the Treasury repurchase agreement (RP) market, complicating the use of such operations in adjusting the short-term supply of reserves.
A few key takeaways from this speech. First, Greenspan was quite cognizant of the risks that the Fed might distort the proper functioning of capital markets. That horse has left the barn. Of course, it’s not just the US horse, there’s a nagging recognition that negative rates and central banks’ accumulation of various assets have distorted markets globally. Second, the repo market is essential to the proper conduct of monetary policy. A repo rate surge like the one we just experienced has the potential to sap confidence, which is why the Fed has taken strong and immediate measures to address it. The t-bill about-face is not just a tweak. The Fed was, as we used to say as kids, a-scared [that’s really REALLY frightened] that they let the market get away from them, exposing the fragility of funding the massive architecture of world-wide debt that has been created.
To conclude, regimes that we take for granted as stable can change pretty quickly. As the Fed supplies liquidity to the front end, long end rates may not respond favorably. In fact, the hawks on the Fed may initially take solace that a rise in long end yields are doing the ‘heavy lifting’. Banks, which are expected to show a yoy earnings decline this week, will welcome a return to a positive yield curve. (C, WFC, JPM, GS report on Tuesday, BAC on Wednesday). But there’s a chance that the Fed, in correcting one aspect of the market that got away, might see dislocations accelerate in another part.
OTHER MARKET/TRADE THOUGHTS
Last week I wrote: “In spite of the end of week stock surge, treasuries closed near the highs. Surprisingly, implied vol in rate futures is not confirming the move, and is slipping on new upticks, especially in bonds. This may portend a change, where vol now has a chance to firm on downticks, which would catch many positions offsides.” Last week’s yield reversal absolutely caught some participants flat-footed.
Rather than consider trades for the week, I am a bit more inclined to take a longer time-frame view. I think yields could easily decline in the beginning of this upcoming week. In tens, I think there’s major yield resistance up to around 1.80%, vs Friday’s 1.755%. I think an instant violation of that area is unlikely, but over the next few weeks we could easily surpass those yields. The market has been conditioned to sell puts on all rate futures as yields increase. I am more inclined to buy puts if yields fall, and to do that further out the curve.
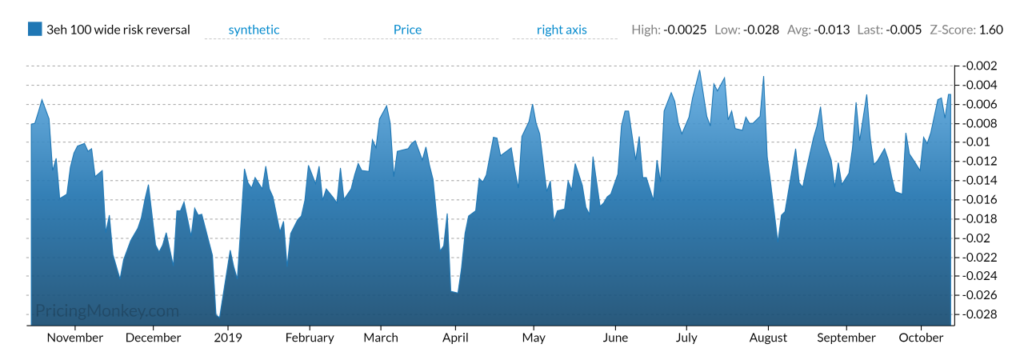
One chart I looked at last week was a synthetic 100 bp wide risk reversal on 3EH (the second quarterly blue midcurve). Here’s an image (in terms of bps). This is synthetic in that time until expiration is more or less held constant over the life of the chart. What it shows is that puts are now gaining on calls on this move…call skew further out the ED curve has diminished appreciably. Contact George Austin at PricingMonkey.com ( george@pricingmonkey.com) or check the Pricing Monkey blog for ideas.
| 9/27/2019 | 10/4/2019 | 10/11/2019 | chg | |
| UST 2Y | 162.2 | 138.8 | 161.6 | 22.8 |
| UST 5Y | 155.1 | 132.4 | 158.2 | 25.8 |
| UST 10Y | 167.5 | 150.7 | 175.5 | 24.8 |
| UST 30Y | 212.5 | 200.4 | 221.6 | 21.2 |
| GERM 2Y | -77.0 | -78.0 | -72.0 | 6.0 |
| GERM 10Y | -57.3 | -58.6 | -44.2 | 14.4 |
| JPN 30Y | 31.8 | 34.6 | 38.3 | 3.7 |
| EURO$ Z9/Z0 | -50.0 | -57.5 | -35.0 | 22.5 |
| EURO$ Z0/Z1 | -8.0 | -5.0 | -7.0 | -2.0 |
| EUR | 109.42 | 109.79 | 110.38 | 0.59 |
| CRUDE (1st cont) | 55.91 | 52.81 | 54.70 | 1.89 |
| SPX | 2961.79 | 2952.01 | 2970.27 | 18.26 |
| VIX | 17.22 | 17.04 | 15.58 | -1.46 |
https://www.federalreserve.gov/boarddocs/speeches/2001/20010427/default.htm

