The Marlboro Man
September 24, 2023 – Weekly Comment
******************************************
In the mid-1950’s Philip Morris gave Chicago advertising upstart Leo Burnett an assignment: Sell Marlboro cigarettes to men. At the time, the filtered pinkish end of the brand gave it more of a feminine aesthetic. The creative agents at Burnett immediately decided to focus on the most masculine of images; the cowboy. They tweaked the package design, ran full page ads, and as described in a documentary, “The Marlboro Man was able to take a product that was considered feminine because of that filter, and suddenly make it seem hardcore. They completely flipped the demographics…” Within a month Marlboro became the top-selling filtered cigarette in New York.

Namesake Leo Burnett said it was one of the greatest campaigns he’d ever seen, “I just jumped out of my chair!” The brand continued to grow with the ‘Marlboro Country’ campaign in the 1960s. The Burnett team thought some of the new cowboy ads looked a bit contrived, so they went out west and starting shooting spots with REAL cowboys. They presented the concept to a research company who warned, “No one can identify with cowboys, if you run this, you’ll run the brand out of business.” The consultants left the room and Jack Landry of Philip Morris said, “Run it”. The campaign worked. Sometimes you’ve got to go with your gut. (And have a strong sense of your core customer).
The documentary is a fantastic slice of old Chicago and classic advertising. Here’s a link:
The Federal Reserve has been involved in a crusade to bring inflation down to its 2% target. Make no mistake, “forward guidance” is an ad campaign. Where Powell has become most successful is in rounding up Federal Reserve members to commit to the same message. And that’s the tagline from the 2022 Jackson Hole meeting: “… we must keep at it until the job is done.”
The Fed knows that bankruptcies have been increasing, that loan delinquencies are moving up, that M2 growth is at an unprecedented level of contraction, that JOLTs on a yoy basis have declined at a 22% rate, only surpassed briefly by the COVID plunge and the fall in 2008 (chart below). If I know it, the Fed knows it. There are many pundits, critical of the Fed, who always start with, “What the Fed doesn’t understand is…”
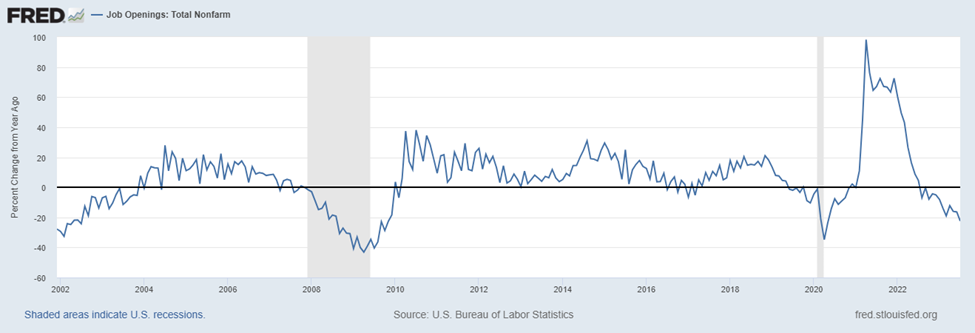
JOLTS yoy % change
It’s clear that the Fed has gotten economic projections wrong, and undoubtedly, their current forecasts are likely to miss the mark. But rather than me giving a half-assed opinion on what the Fed has missed, I think I’ll focus on not missing what the Fed is telling me: The trend for long-dated assets is now lower. The 50 bp increase in the FF forecast from June’s 4.6% to last week’s 5.1% is a crystal clear endorsement of the “higher for longer” advertisement. Longer dated assets had pinned hopes on a Fed flip to easing. After the June FOMC, the red SOFR pack was around 9625 or 3.75%. On Friday the reds ended at 9570 or 4.3%. Post-June FOMC 10s were 3.75%. On Thursday the yield poked above 4.5% and ended 4.436%, up over 11 bps on the week and nearly ¾% higher than late June.
I’m not saying that stocks go straight down, or that something can’t break (hard) and throw the entire macro environment for a loop. Many trades in US rates have the theme of “forced easing, when does it happen and how hard could it be?” For example, there was a buyer last week of 40k SFRF4 9475/9525/9575c fly for 3.5 to 3.75. With current EFFR of 5.33% it’s clear that this trade requires strong expectations of easing, starting at the end of 2023 or in the beginning of the new year. (Jan options expire Jan 12, with SFRH4 underlying, well before the Jan 31 FOMC). The middle strike is 4.75%. Again, I would mention something like SFRZ3 9475/9550c 1×2 for 0.25 credit to buy the lower strike. A strong perception of ease starting at the Jan 31 FOMC or before would put this trade in play. However, the Fed’s muted response to the regional banking problems of March make it clear that the bar for easing is now quite a bit higher than previously thought.
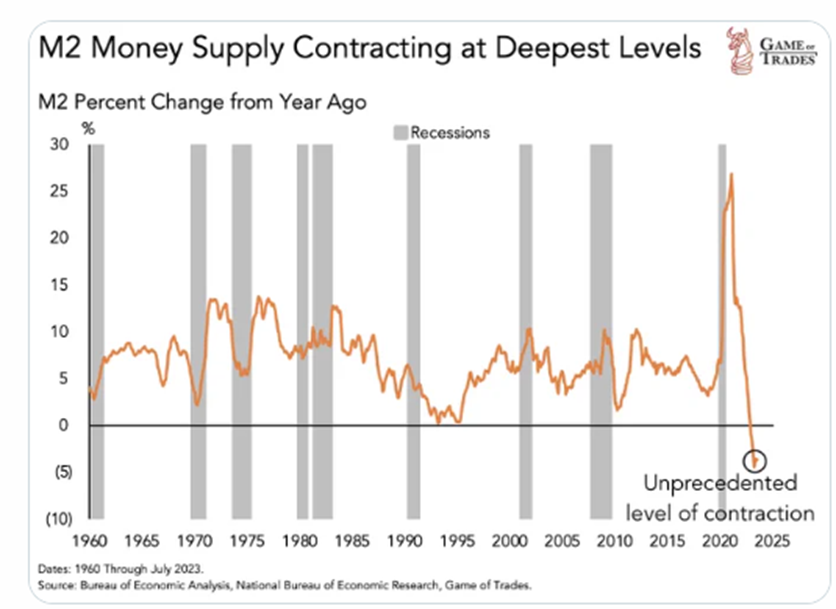
Credit: Game of Trades
The Fed is using its tools to slow the economy and create tighter financial conditions, which includes lower equity prices. The terminal FF rate has perhaps already been achieved, or will be with one more hike. But the tool that is never mentioned is patience. Let the weight of high short-term rates work through the system. Funding rates above all measures of inflation will create a lot of angst for companies that need to roll debt in the coming year. Some won’t make it. The ‘real’ rate as expressed by the ten-year inflation-indexed note is at its highest level since 2009, ending the week at 2.06%. Additionally, banking issues continue. Year-over-year bank credit (chart below) resembles M2. Take a look at a chart like Bank of America (BAC). It’s near the low of the year and is essentially equal to the level associated with SVB in March. BAC looks about the worst, but KRE (US regional bank ETF) and BKX (KBW Nasdaq money-center bank index) are both on recent lows and below the original plunge levels of mid-March.
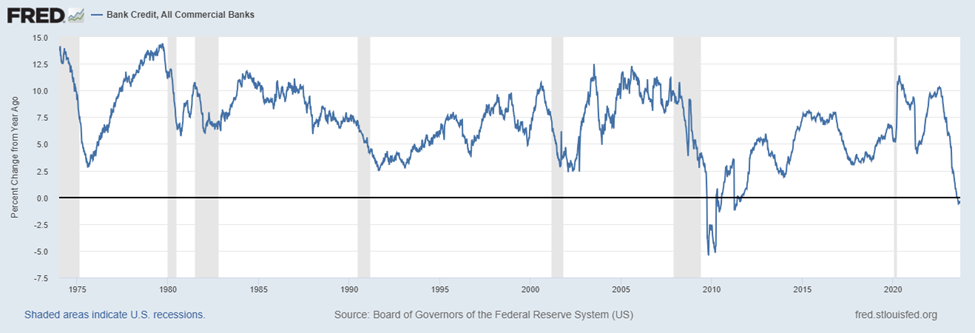
Yoy growth in bank credit
This week includes auctions of 2, 5 and 7 year notes. Should sail through as only $16b in new cash is being raised. The week (and month) ends with PCE prices, expected 3.5% yoy vs 3.3% last, with yoy Core 3.9% vs 4.2% last.
There was a powerful scene in the Chicago documentary featuring a black woman, Carol H Williams. Hired in 1969 in an obviously tough environment, she rose to creative director and vice president in six years. “I loved Burnett from the first time I walked in there.”
“I was not afraid to take the shot and I took the shot”
Maybe the Fed (or the entire country) could use her to head up communications!
OTHER THOUGHTS/ TRADES
On June 1 the Dec’3/Dec’4/Dec’5 butterfly settled -141 (9521.0/9682.0/9702.0). On Friday it settled at the high of the year, -14.5 (9453.0/9535.5/9603.5). Obviously, the biggest adjustment was SFRZ4 which declined nearly 150 bps in four months. SFRZ3/Z4 went from -161 bps to -82.5. The forward guidance on higher for longer has been reflected in these spreads. Over the same timeframe, the 30y bond yield has risen from 3.81% to 4.52%. While the sell-off in red SOFR contracts may not have a lot more to go, it’s more difficult to make that claim on bonds, especially as a possible gov’t shutdown further exposes runaway spending (and laughable political efforts to stop it).
COST (Costco) reports Tuesday. Stock is near the high of the year. Clues about the health of the consumer.
MU (Micron Technology) reports on Wednesday after close. It’s been a beneficiary of the AI splurge. Possible sign that this mania has been tempered?
| 9/15/2023 | 9/22/2023 | chg | ||
| UST 2Y | 503.5 | 512.0 | 8.5 | wi 507.0/506.5 |
| UST 5Y | 445.3 | 456.7 | 11.4 | wi 457.0/456.5 |
| UST 10Y | 432.2 | 443.6 | 11.4 | |
| UST 30Y | 441.2 | 451.8 | 10.6 | |
| GERM 2Y | 321.5 | 325.9 | 4.4 | |
| GERM 10Y | 267.5 | 273.9 | 6.4 | |
| JPN 20Y | 142.8 | 144.9 | 2.1 | |
| CHINA 10Y | 266.8 | 269.2 | 2.4 | |
| SOFR Z3/Z4 | -97.0 | -82.5 | 14.5 | |
| SOFR Z4/Z5 | -63.5 | -68.0 | -4.5 | |
| SOFR Z5/Z6 | -9.0 | -8.5 | 0.5 | |
| EUR | 106.60 | 106.45 | -0.15 | |
| CRUDE (CLX3) | 90.02 | 90.03 | 0.01 | |
| SPX | 4450.32 | 4320.06 | -130.26 | -2.9% |
| VIX | 13.79 | 17.22 | 3.43 | |

