The Climb
August 14, 2022 – Weekly Comment
I was walking east down Monroe Street, coffee in hand, to enter the Chicago Mercantile Exchange from the south entrance. It was a hazy and slightly humid August morning, the time of year when you notice it’s not quite as bright as it was a couple of weeks ago, as the days shorten. I had crossed the bridge over the Chicago River and noticed a sparse crowd of people on the corner ahead, all looking up. In the next moment I learned there was a guy scaling the west face of the Sears Tower*, which is one block to the south of the CME, on the opposite side of Wacker Drive.
I became riveted as one with the onlookers. The opening bell is 7:20, and the hard rule is to be at the desk before the open. If you’re hungover, you can sneak off to the breakroom for a nap after the 7:30 data, but you make the opening bell. Period. I knew I might not make the open that day, because I instantly committed to watching this guy make it to the top.
About ten minutes before 7 a.m. we actually lost sight of him, as he was obscured by wisps of clouds. The building is 110 stories, 1450 feet tall. The date was August 20, 1999, a Friday. At about 7, he reached the top and was promptly arrested by Chicago’s finest. I was thrilled for him and… I made the opening bell.
The man was Alain Robert, known as the French Spider Man. No tools, no ropes, he had already scaled many buildings in Europe and the Golden Gate Bridge.
No, I am not going to compare the current time with 1999, though there was particular interest at the turn of the century due to Y2K. My analogy is little more than an indulgence of memory to use in relation to the Fed’s current tightening campaign. In terms of Alain Robert, either you make it or you don’t. The Fed doesn’t know exactly where it is on the climb to higher rates, though the market has given a pretty good idea of the terminal rate at around 3.5%. I feel as if we’re sort of in the area of wispy clouds where you can’t quite see how it’s going to unfold, but the market is giving strong hints.
Last week’s inflation data was slightly better than expected, but after an immediate post-CPI surge in treasury futures, prices quickly faded. Yields closed a bit higher on the week, led by the long end. The two year yield rose only 1 bp on the week to 3.255%, while tens rose 2 to 2.849% and thirties rose 7.5 to 3.117%. In the month of August, TYU2 is repeatedly rejecting the highs. The high of the month so far was 122-02 on August 2, coinciding with Pelosi’s Taiwan gambit. That day’s settle was nearly 2 points off the high at 120-04. On August 5th we had the strong employment report. Pre-report high was 120-24+ while the settle was at the bottom of the range 119-12. On August 10 came lower than expected CPI; TYU2 popped to 120-22, but closed in the bottom half of the range at 119-24. The month’s price action has been bearish (the big range days are all rejections of the upside) and we’re moving ever closer to more serious QT beginning in September with $60 billion in treasuries being allowed to roll-off the Fed’s balance sheet, along with $35b in MBS. This doubling in QT (from $30b and $17.5b per month) should be a negative for bonds, but if the effect is a drain in liquidity from stocks, then a rise in yields may be limited. Recall that starting in October 2018 the Fed ratcheted up QT from $40 billion per month in the previous quarter to $50 billion, which perfectly coincided with the onset of a 20% Q4 slide in SPX.
The market ended the week essentially balanced in terms of the expectation for a 50 bp hike at the Sept 21 FOMC vs a 75 bp move. October Fed Funds settled 9705.5 or 294.5 bps. A 50 bp hike would cause a final settle at 283 and 75 would result in 308. The question in terms of the Fed’s rate path will likely be settled by the September 2 employment report. The next CPI release is 9/13. I believe that the Jackson Hole conference (August 25 to 27) will provide a solid lean toward 50 bps and NFP will seal the deal. Last year Powell spoke on the Friday morning of the conference, which would be the 26th this year, but I don’t see it on the Fed’s calendar yet.
The lowest one-year calendar spread on the Eurodollar curve is EDM3/EDM4 at -79 (9616.5/9695.5). On the SOFR curve it’s also M3/M4 at -75.5 (9646.0/9721.5). These are about the lowest that one-yr calendars ever get. Kashkari last week pushed back against the inverted short-term curve, saying “The idea that we’re going to start cutting rates early next year, when inflation is very likely going to be well in excess of our target, I just think it’s unrealistic.” Well, you might not agree with the market Neel, but SFRM3/M4 was down 6 on the week (more inverted) and it had ended May at -30.5, so it has inverted an additional 45bps in the past two and a half months.
In fact, if the Fed guides towards a more moderate pace of hiking, as Mary Daly did last week in citing a base case of 50 in September, the long end may continue to grind to higher rates (especially given the QT bump) which would go a long way in stifling enthusiasm for long dated risk assets. Inasmuch as rising stocks bolster confidence and, at the margin, increase consumption, thus underpinning inflation, an increase in bond yields might have the opposite effect, and aid in the destruction of demand which is central to the Fed’s goal.
If the Fed slows down the pace of tightening, then one might expect nearer contracts to rally, as aggressive hikes are priced out. That seems to be the bias in the very near part of the curve. For example, SFRZ2/Z3 one-year calendar settled at its high since the end of June, at -39.5. The low in this spread was one month ago on July 13, at -73. The most inverted spreads are moving a bit farther away in terms of time.
In summary, I would say that the interest rate curve is sending the following messages:
1) The pace of tightening is likely to slow down and be pushed slightly longer than had been priced in June
2) Restraining actions by the Fed, in terms of both rate hikes and QT, will put hard brakes on economic growth that will eventually result in easing.
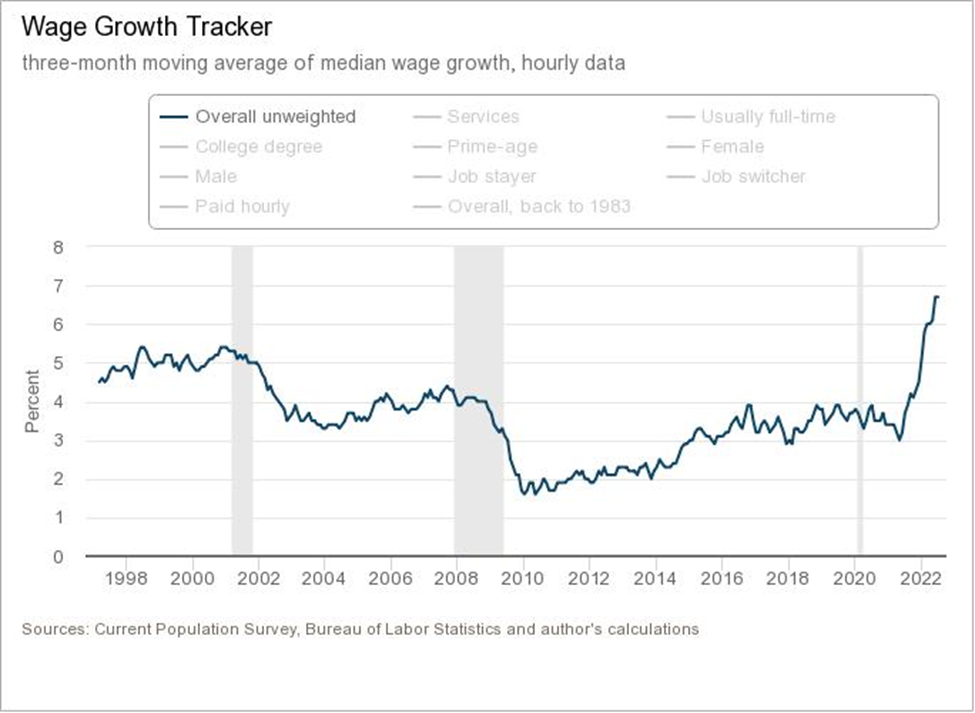
3) The longer end of the curve must contend with inflation that may not come down as quickly as had been hoped, and with extra supply due to QT. (In terms of stubborn inflation concerns, see chart which Is the Atlanta Fed’s Wage tracker).
News on the week includes
Monday: Empire Mfg
Tuesday: Housing Starts, Industrial Production
Wednesday: Retail sales and FOMC minutes
Thursday: Job Claims and Philly Fed, Existing Home Sales
| 8/5/2022 | 8/12/2022 | chg | ||
| UST 2Y | 324.4 | 325.5 | 1.1 | |
| UST 5Y | 297.4 | 297.7 | 0.3 | |
| UST 10Y | 282.8 | 284.9 | 2.1 | |
| UST 30Y | 304.3 | 311.7 | 7.4 | |
| GERM 2Y | 47.8 | 60.8 | 13.0 | |
| GERM 10Y | 95.5 | 98.7 | 3.2 | |
| JPN 30Y | 115.3 | 109.7 | -5.6 | |
| CHINA 10Y | 274.6 | 274.3 | -0.3 | |
| EURO$ U2/U3 | 2.5 | 25.0 | 22.5 | |
| EURO$ U3/U4 | -59.5 | -69.5 | -10.0 | |
| EURO$ U4/U5 | -22.0 | -26.5 | -4.5 | |
| EUR | 101.84 | 102.61 | 0.77 | |
| CRUDE (active) | 89.01 | 92.09 | 3.08 | |
| SPX | 4145.19 | 4280.15 | 134.96 | 3.3% |
| VIX | 21.15 | 19.53 | -1.62 | |
*Sears Tower is now known as Willis Tower
https://www.chicagotribune.com/news/ct-xpm-1999-08-21-9908210013-story.html

