SOFR pricing
March 23, 2025 – Weekly Comment
************************************
Peak contracts on the SOFR strip have been in the 6th and 7th slots, what I would refer to as the middle reds. Current peak is SFRU6, 2nd red, sixth slot, which settled 9654 or 3.46%. Despite increased measures of inflation expectations, both from surveys and from the Fed’s own SEP, Summary of Economic Projections, SFRU6 settled only 2.5 bps lower than its high on 10-March of 9656.5. (Fed’s Core PCE price estimate for end-of-2025 was raised from 2.5% in December to 2.8% in last week’s SEP). On February 18, just over one month ago, SFRU6 settled 9603, so the yield is down 50 bps in a month. The market doesn’t seem to be embracing the idea of a sustained increase in inflation. The current EFFR (Fed Effective Rate) is 4.33%, so SFRU6 yield is 87 bps lower.
Below is the red/gold pack spread. It’s nearing the high made in September just before the initial 50 bp Fed cut from 5.25-5.5% to 4.75-5%.
Let’s take a look at pricing going into the Fed’s initial ease in September. We can see that the red/gold pack spread rallied through Q3 2024 as easing expectations grew. The unraveling of the spread after the initial 50bp cut (late Sept thru November) was sparked by fears that inflation might be re-kindled by the oversized move. (It was). SFRH6, the second red at the time, sold off from 9720 to 9610 on Nov 12. SFRU6 followed the same script, 9720.5 high settle on 10-Sept, to 9614.5 on 12-Nov.
Let’s review the Survey of Economic Projections from the September 2024 meeting, focusing specifically on the 2025 predictions.
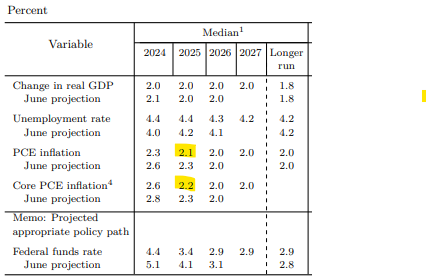
In September, the second red, which was SFRH6 at the time, had traded up to 9720 just before the FOMC. At the time, the Fed ratcheted DOWN inflation estimates from 2.3% for PCE prices and Core, to 2.1 and 2.2 (yellow highlight). So 2.8% in second red futures price vs 2.1 for inflation, a spread of around 60 to 70 bps. Low given estimates for the neutral rate.
But we’re in a similar place now. 2.7 to 2.8 for inflation estimate vs second red of 3.50%, a spread of 70 to 80 bps.
My view is that the Fed is likely overshooting the inflation estimates for end-of-2025, just as they undershot in September. We’ll probably end up somewhere in the middle, 2.3 to 2.5.
In early September, FF midpoint was 5.375%, and the second red had traded to 2.80%, over 250 bps lower. Currently, from a 4.375% midpoint, the second red yield is about 3.5%, or 90 bps lower.
My conclusion, to paraphrase Powell’s description of the economy and policy, is that we’re in a pretty good place in terms of the price/yield levels for red SOFR contracts. My thought is that inflation estimates are currently too high, so there’s probably room on the upside for reds, but overall pricing makes sense.
Expanding a bit further, the chart below is ESM5 in white, with an overly of SFRU5/SFRU6/SFRU7 butterfly in green. The fly is (SFRU5 – SFRU6) – (SFRU6 – SFRU7). As SFRU6 rallies more than the wing contracts, the fly declines in price. In the last couple of months, S&Ps and the fly have tracked closely. But in the past few sessions, stocks bounced while U5U6U7 made new lows.
So what? There are a lot of correlated markets that have nothing to say about causation. (Though it appears that the fly has been the leader). I would simply summarize, ‘stocks selling off in a financialized economy means that reds rally hardest.’ It’s not all that obvious in terms of constructing new trades given moves that have already been significant.
My interpretation of the fly is that the Fed’s ‘inertia’ concerning near-term rate cuts is due to tariff-related inflation fears. SOFR contracts one year forward (reds) are sniffing out economic weakness, accentuated by falling asset values. Beyond the reds, an increase in term premia could result from a weaker economy where budget deficits worsen due to lower tax receipts and higher gov’t benefits, for example, higher unemployment payments.
An interesting quote from Luke Gromen’s Forest for the Trees that someone passed along to me:
“The time for delicate talk is over, so we will be blunt: You cannot “detox” the US economy when debt/GDP is 120%, deficits/GDP are 7%, and “True Interest Expense” is 108% of all-time high receipts, all of which are dependent on ever-rising asset prices to prevent a decline in consumer spending and US Federal receipts.”
| 3/14/2025 | 3/21/2025 | chg | ||
| UST 2Y | 401.7 | 394.6 | -7.1 | wi 392.5 |
| UST 5Y | 408.4 | 400.8 | -7.6 | wi 401.4 |
| UST 10Y | 431.0 | 424.8 | -6.2 | |
| UST 30Y | 461.5 | 459.2 | -2.3 | |
| GERM 2Y | 218.7 | 213.2 | -5.5 | |
| GERM 10Y | 287.4 | 276.5 | -10.9 | |
| JPN 20Y | 226.4 | 226.2 | -0.2 | |
| CHINA 10Y | 185.1 | 185.2 | 0.1 | |
| SOFR M5/M6 | -47.5 | -59.5 | -12.0 | |
| SOFR M6/M7 | 4.0 | 5.0 | 1.0 | |
| SOFR M7/M8 | 12.5 | 14.0 | 1.5 | |
| EUR | 108.79 | 108.22 | -0.57 | |
| CRUDE (CLK5) | 66.91 | 68.28 | 1.37 | |
| SPX | 5638.94 | 5667.56 | 28.62 | 0.5% |
| VIX | 21.77 | 19.28 | -2.49 | |
| MOVE | 101.01 | 94.54 | -6.47 | |

