Sept 30. Stocks and Commodities
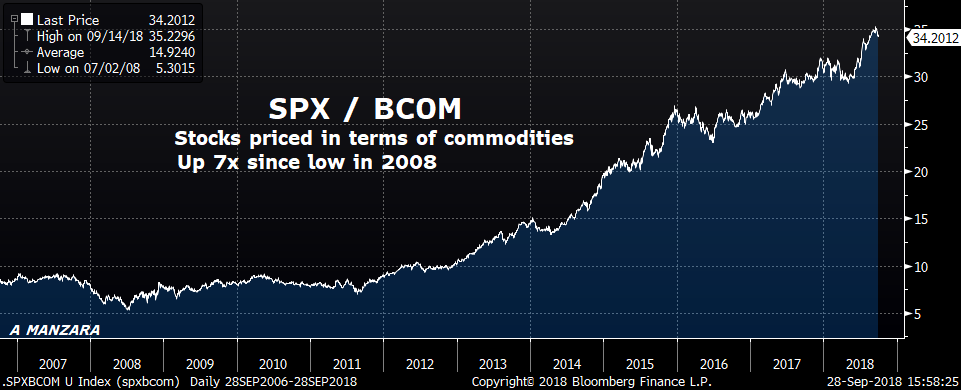

The top chart is SPX divided by the Bloomberg Commodity Index; financial assets versus physical things. Clearly, as the service sector has expanded, commodities have become less important. The lower chart shows the two asset classes individually. When just considering BCOM, it almost seems that one could make a case for still being mired in slow growth or recession as this index is below the crisis low of 2009.
Of course, in a general way that’s understandable. For example, even though UBER isn’t public, increased cash flows (and an increase in GDP) on a given stock of vehicles due to sophisticated software and (less-sophisticated) driver services is being constantly replicated in various parts of the economy. Driving yourself adds nothing to GDP, but taking a car service does. In the military arena it may be the case that cyber-security is becoming more important than physical hardware.
The question becomes whether the amount that is being paid for potential streams of income (stocks) is too high relative to necessary commodities. For example, WTI crude oil was up $2.50/bbl on the week and is nearing the high of the year for the front contract on a rolling basis. Perhaps the BCOM chart simply reflects a transfer of wealth to developed economies from underdeveloped ones that rely more on the latter. It’s an open question, but I would think the turn in commodities is closer than it appears in the rearview mirror. If the acceleration of wages occurs simultaneously, then an ironic shift of sentiment could emerge: that inflation is too high relative to target. Note that after having decelerated in 2017, the Atlanta Fed’s wage tracker has shown a solid rebound this year. On Friday the employment data will contain yoy average hourly earnings, expected +2.8%, which is perhaps the most important piece of data on the week.
https://www.frbatlanta.org/chcs/wage-growth-tracker?panel=1
Back at the height of the mortgage withdrawal orgy around 2005/06, I recall home equity extraction of about $60 billion per month. Although the economy is larger now than it was then in nominal terms, that monthly amount has always sort of stuck with me as a tipping point of sorts. It’s probably not a valid comparison, but starting this month (October) the Fed’s normalization program increases from $40 billion to $50 billion per month. This, at the same time that the US deficit is projected at around $1 trillion, or $80 billion of new supply per month. Taken together that’s more than double the $60b/month tipping point. Late on Friday, we saw steepening pressure on treasuries, sparked by the Comcast bond offering (this week) tied to the purchase of Sky from Fox. In a repetition of a previous theme, it seems like supply is beginning to matter. In the past week, the ten year yield rejected the year’s high at 3.11%. The next test could come this week prior to Friday’s employment report. Yields have the potential to move significantly higher.
Several times during the FOMC press conference, Powell stated that keeping the financial system sound was of critical importance. Perhaps worth mention is that the US banking index BKX closed the week at its low, near the low of the year, off about 10% from the high set in Q1. Clearly the US banking sector is in good shape, but it’s interesting to note that that the Italy bank index is under the lows associated with the election turmoil in late May. At that time, German and US yields took a big drop. For example, on June 1, I marked the bund at 39 bps, down from 58 two weeks prior. It’s now 47 bps. The US ten year on June 1 was 2.89%, and is now 3.05% having had two rate hikes in the interim. In late May the euro had traded to 1.15. It has since gone sideways, and is now around 1.16. There are still risks to the global financial system related to Italy and its higher-than-projected budget deficit announcement of 2.4% of GDP, along with problems in various emerging market economies. As one paper noted, the Fed has swap lines with developed economies to smooth funding problems, but not with emerging market economies.
Below is a chart of EUR/USD 3month cross currency basis, which reflects an increase in funding pressures. While the big spikes lower in the previous two years were in December, Friday displayed a significant drop which may portend further weakness.


