Send Lawyers Guns and Money
Oct 6, 2019 Weekly Comment
How was I to know, she was with the Russians too.
–Warren Zevon
The first comments on the thread of this youtube video are “I’m playing this loud, to annoy the neighbours, as revenge for waking me up with the hedge trimmer.” In response, “I don’t always listen to Zevon, but when I do, so do the neighbors!”
How was I to know Lawyers Guns and Money would be a global anthem? Play this one at top volume. The neighbors will love you for it.
Lawyers for Trump, Guns for entire world and Money from the Fed. The September repo scare focused the Fed on liquidity issues. Since then it’s been non-stop repo operations, with no end in sight. The two-year yield dropped over 23 bps this week. In my book that’s an ease! With a 2-yr yield of 1.388%, it’s back to where it was in Q3 2017. That’s five hikes (and two cuts) ago for those keeping track. Of course, tens and 30s are within spitting distance of new all-time lows, with tens ending at 1.507% and bonds at 2.004%, and that’s with supply on tap. This week treasury auctions $38b 3’s, $24b 10’s and $16b 30’s, raising $54 billion in new cash. Yeah, that stuff needs to be financed. Or monetized.
At the same time, corporate bond sales are off the charts with $434 billion in global corporate bond issuance in the month of September, a record. (CreditBubbleBulletin). Borrowers are thrilled to refinance at these rates. Lock in now and secure financing while we can.
A quote from Almost Daily Grant’s (10/4/19) sums up the other side of the equation. “Needless to say, this vanishing interest-rate epoch has been less kind to lenders, particularly pension funds which are chasing increasingly daunting annual return targets. …Private equity has been all too happy to step into the void.”
Of course, private equity has experienced
some shrinkage as well, thanks to WeWork, and to a lesser extent Uber (and let’s
welcome Peleton to the club, the next Blue Apron). A facetious staff memo from an imaginary
founder written in the WSJ captures the environment. It starts,
“Folks, I know everyone was excited about cashing in on our upcoming public
offering, but it looks like this whole ‘profitability’ craze is here to stay,
at least for a while.”
The problem from a macro perspective, is that these cash-burners employ people. And those folks are about to become a statistic for future payroll reports. It might just be a one-off, but remember how layoff announcements used to spark buying in the stock, as cost-cutting was perceived as improving profitability? Well, Hewlett Packard announced layoffs of 7000-9000 of its 55,000 workforce, and the shares dropped 9.6% Friday with Nasdaq up 1.4%. I’m sure it’s just an isolated event…
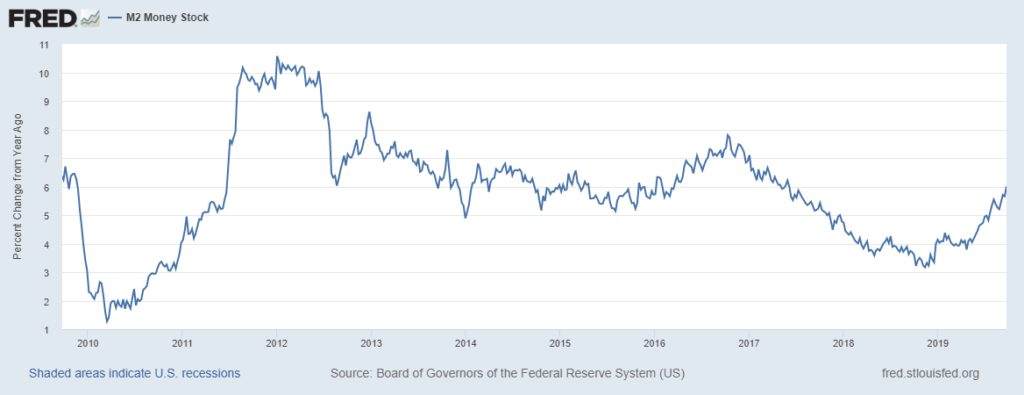
It was ISM data that sparked the latest yield plunge, with Mfg at 47.8 and Services, while still showing growth, much lower than expected at 52.6. The Fed is responding with Money. Below is a chart of the annual growth rate of M2 from the St Louis Fed, last at 6%. Acceleration this year has been rapid and consistent. A long time ago, M2 growth was considered a precursor to inflation. We’ll get a sense of whether it holds true now, with PPI out Tuesday, yoy Core expected 2.3% and CPI Thursday with yoy Core expected 2.4%. Of course, workers’ earnings from Friday’s employment data slowed, to an annual rate of 2.9%.

M2 Growth- St Louis Fed
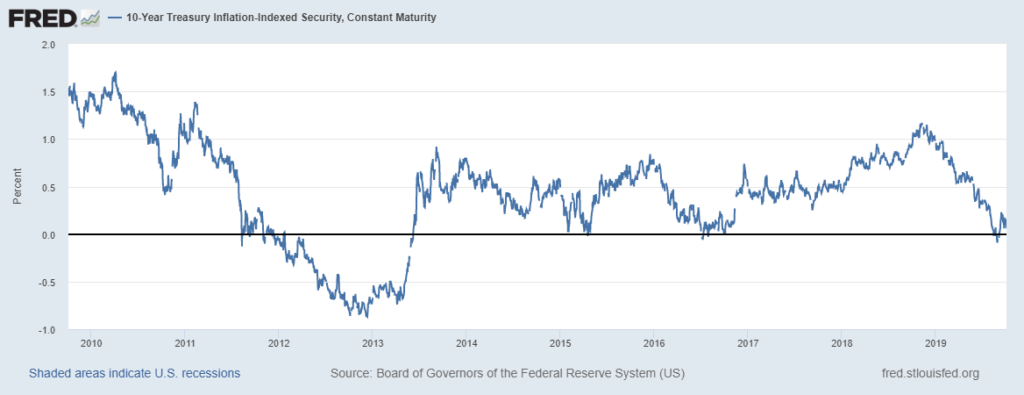
One other yield level worth mention is the ten year inflation-indexed note which ended the week barely above zero at half a basis point. I.e. the real yield is zero. The entire return comes from CPI. After the 2018 tax package the real yield was over 1%. Now it has vanished. Like the neutral rate. As can be seen on the chart below, the zero level also occurred in Q1 2015 and mid-2016, when all yields made their lows. In 2012 it was significantly negative as the Fed tried to force investment further out the risk spectrum.
I don’t know if the FAANG stocks are an appropriate measure for ‘seeking risk’ or now more of a flight away from to safety, but it’s sort of interesting to note that mid-2016, after the late 2015 oil and emerging markets plunge, is when US yields posted their lows, with tens for example reaching 1.36%. So where were some of the high-cap risk stocks? Here’s a partial list, with mid-2016 levels followed by current: FB was 120, now 180. AAPL 100 to 227, AMZN 750 to 1740, NFLX 100 to 270, GOOGL 800 to 1200, MSFT 55 to 138. This, at the same time a shadow has been cast over IPOs. Doesn’t seem as if it will be as easy to shift investors out the risk curve from these levels. Warm up those helicopters. With impeachment, Brexit, Iran & Saudi Arabia, stagnant China talks, Hong Kong, slowing EZ growth as Lagarde takes over the ECB, etc, uncertainties are piling up (with N Korea making a new push for the limelight). It’s little wonder that money is seeking shelter. It’s like the turtle hatch, when all those little turtles are racing for the safety of the sea. A lot of them will be eaten and never make it, so the strategy is sheer numbers. That’s where the Fed is, err on the side of big numbers.

Ten year inflation indexed note yield –St Louis Fed
While Mfg ISM decelerates, it’s also somewhat interesting to look at industrial mainstays oil and copper. From the lows made in early 2016 to the highs in 2018, both are around halfway retracements, with copper just below the midway area. Oil continues to shrug off the attack on Saudi supplies, closing near the low of the week, essentially telegraphing that a global slowdown doesn’t require as much of the stuff.
Fed minutes released this week on Wednesday.
OTHER MARKET/TRADE THOUGHTS
Since mid-Sept there has been an
extraordinary short squeeze in EDZ9 of over 25 bps, with Friday’s settle
pulling back a bit to 9817.0. The spread
between EDZ9 and FFF0 is still firm at 37.5, but it has pulled back from the
low 40’s. End of year funding tightness
remains a concern.
On Oct 1, I noted that Oct/Nov FF spread was -9.25 and Nov/Jan FF spread was
-16.0. These spreads more or less
isolate the Oct 30 and Dec 11 FOMC meetings.
Both indicate that cuts are coming, but the odds of an ease at the Oct
meeting were much lower than those for December. Towards the end of the week, both spreads
were below -19, with the market pushing for an October ease to counter weak ISM
data. Closes Friday were -17.75 and
-20.5. (Pricing one and a half cuts by
the end of the year).
In spite of the end of week stock surge, treasuries closed near the highs. Surprisingly, implied vol in rate futures is not confirming the move, and is slipping on new upticks, especially in bonds. This may portend a change, where vol now has a chance to firm on downticks, which would catch many positions offsides. A Fed which errs on the side of ‘easy’ to insure against a funding crisis, along with continued bond supply could conspire to push the inflation boulder just a little bit closer towards a slope where it picks up speed on its own accord. While that particular narrative doesn’t have many proponents, it’s worth keeping in mind. In 1993, when the Fed kept funds at the then unheard-of-low of 3% for a year, the 1994 rate increase jolt sent bonds into a tailspin. The Bernanke taper-tantrum of 2013 had a similar effect. In those instances, it was fear of central bank tightening. Is it possible that (global) central bank laxness could now inspire the same sort of bust in the long end?
One trade I mentioned last week was EDH0 9850/9875/9900 c fly for 2.25 ref 9833.5 (previous Friday settles). I wasn’t looking for an instant 30 bp rally to Friday’s 9853.0. This fly settled 3.75. Worth holding as the market once again looks for the Fed to target a funds rate of 1.0 to 1.25%.
October midcurves in eurodollars expire Friday. EDZ0, EDZ1 and EDZ2 are all at the 9875 strike: 9874.5, 9879.5 and 9874.0. The next strike lower, 9862.5 puts, settled 1.25, 0.50 and 1.25. That was a low settle for 2EV 9875p, but any one of these could play over the coming week.
| 9/27/2019 | 10/4/2019 | chg | |
| UST 2Y | 162.2 | 138.8 | -23.4 |
| UST 5Y | 155.1 | 132.4 | -22.7 |
| UST 10Y | 167.5 | 150.7 | -16.8 |
| UST 30Y | 212.5 | 200.4 | -12.1 |
| GERM 2Y | -77.0 | -78.0 | -1.0 |
| GERM 10Y | -57.3 | -58.6 | -1.3 |
| JPN 30Y | 31.8 | 34.6 | 2.8 |
| EURO$ Z9/Z0 | -50.0 | -57.5 | -7.5 |
| EURO$ Z0/Z1 | -8.0 | -5.0 | 3.0 |
| EUR | 109.42 | 109.79 | 0.37 |
| CRUDE (1st cont) | 55.91 | 52.81 | -3.10 |
| SPX | 2961.79 | 2952.01 | -9.78 |
| VIX | 17.22 | 17.04 | -0.18 |

