Self Reinforcing Tighter Conditions
Starting with a couple of charts.

What do these two have to do with each other? Well, it’s pretty obvious, Italians are not buying new homes. (I’ll be here all week).
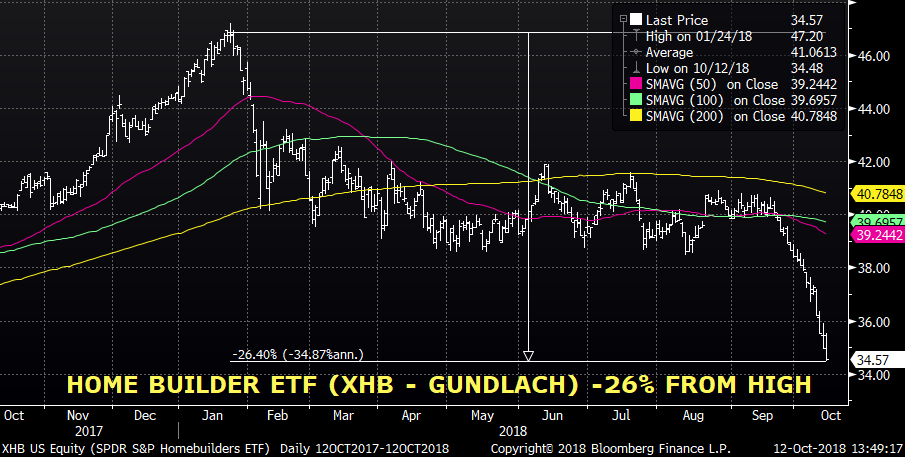
Besides that, both charts, in a way, are real time reflections of financial conditions. I cite Gundlach in the XHB chart because he menitoned carnage in homebuilders as a worry. Actually, there are a lot of charts in both the US and across the world that show comparable stresses and percentage declines for a variety of similar and dissimilar reasons. For example, this weekend Draghi told the Italian gov’t to “calm down” and stop questioning the euro. However, the official stuff in the US isn’t registering concern. For example, I looked at several Federal Reserve data series which purport to measure financial conditions. Chart below shows St Louis Fed’s Financial Stress Index (blue) and Chicago’s National Financial Conditions (Red). Both are below zero and trending down. No problems, right?

Former NY Fed President Dudley outlined several variables related to financial conditions: Short and long term rates, the value of the dollar, the level of equities, and corporate spreads. These are circular and dynamic indicators. Movements in some of them eventually affect the others which have the potential to culminate in a 2008/09 self-reinforcing spike. So when the Fed says they don’t want to rely exclusively on models, I suppose that the chart above – which contains model inputs and indicated little (and lessening) stress going into the financial crisis – is a reasonable argument for human interpretation and intervention regarding policy choices.
There was an informative Bloomberg article over the weekend regarding corporate spreads with excerpts below.
The result has been a surge in debt issuance in the lowest rungs of investment-grade—the biggest share of it driven by corporate acquisitions. There’s now about $2.47 trillion of U.S. corporate debt rated in the BBB tier, more than triple the level at the end of 2008. It now makes up a record 49 percent of the investment-grade bond market and has eclipsed the entire U.S. junk bond market, according to Bloomberg Barclays Index data. In 1993, for example, just 27 percent of blue-chip corporate bonds were rated at the BBB tier.
The worry now is that, with so many of those BBB ratings dependent on the ability of companies to deliver on their debt-cutting promises, any hiccup in the economy or exodus of investor cash will lead to a surge of downgrades to junk. That could lift companies’ borrowing costs substantially, adding new strains to those companies. And if it were to happen en masse, it could overwhelm the $1.3 trillion U.S. speculative-grade debt market and potentially cause the weakest borrowers to lose access to capital.
https://www.bloomberg.com/graphics/2018-almost-junk-credit-ratings/?srnd=premium
In 2007 it was adjustable rate and subprime mortgages which sparked the crisis. In considering the path forward, the factors we have to be concerned with are inflation and rates. I have used this quote from Albert Edwards of Soc Gen before, but I think it captures the big picture: “As the bond rout continues, the biggest call investors have to make is whether the break of the multi-decade downtrend marks the end of the secular bull market. This is the big one. Get on the wrong side of a new multi-year bear market in gov’t bonds and all investment portfolios will be shredded to ribbons, as bonds are the cornerstone of most equity valuation models.”
But it’s not just the price of capital, it’s availability and access.
A quick comment on inflation: Ben Hunt of Epsilon Theory, wrote an article where he argues that the inflation narrative is strongly taking hold. His methodology relies on AI which scans Bloomberg articles for comments on inflation, and relates those comments back to the main theme of the stories. The results are graphed, and my personal analogy is that these disparate comments are being gravitationally drawn together over time into the mass of a celestial black hole; the story itself BECOMES inflation. [Yes, I’ve overstated conclusion, but it’s a good read, below]
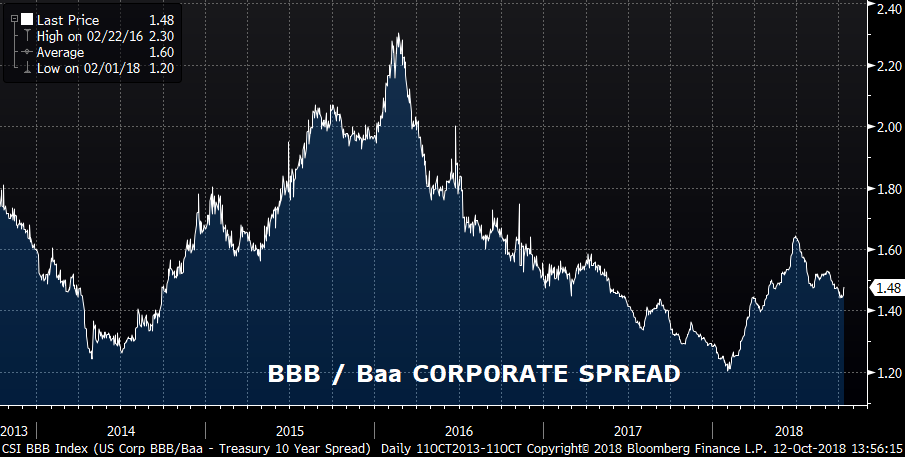
Back to rates and availability. The junk bond flare-up in late 2015/early 2016 was related to collapsing energy prices and emerging markets. It was, and remained, fairly specific. If there were to be another big crisis, it’s not going to be related to mortgages. By 2004-2006 the share of total subprime mortgages had doubled from the years previous to around 20% or $1.3T, but subprime ARMS were only 6.8% of all mortgages outstanding. Comparing these percentages to those in the Bloomberg BBB article, it seems as if the lower credit quality of the corporate market has the potential be much broader in scope and more pernicious in effect than 2015. Could it rival 2008/09 if ratings agencies start a series of downgrades? Both the level of rates and the level of spreads are critical in terms of companies’ servicing obligations. Rates, have of course, increased, with three hikes since the start of the year. The spread (chart below) took a jump in the early part of 2018, perhaps connected to the Feb VIX spike. While the spread is off the high of summer, actual debt servicing costs have increased. Note that many asset managers can’t hold junk. There are parallels to the GFC, but if problems DO develop, the main players won’t be gullible overleveraged households losing homes due to evil banks, it will be corporate entities that willingly engaged in a financial engineering minuet with bankers. The Trump administration is familiar with bankruptcy. The government will be much less inclined to provide assistance.
The broad points are that inflation is taking hold even if growth decelerates. If the Trump administration moves towards even more stimulus, the market may become less welcoming in absorbing supply, and the Fed has demonstrated a willingness to lean against fiscal profligacy. Financial conditions can easily tighten, rapidly, just through market action and demand for more compensation for funding in the face of an increase in perceived risk.
******************
Earnings season is kicking off. US news includes Retail Sales on Monday. Industrial Production and JOLTS on Tuesday, Housing Starts and FOMC MINUTES on Wednesday. Philly Fed Thursday and Existing Homes Friday.
Reports circulated late last week that Treasury staff had advised Mnuchin that China is not manipulating the yuan. The official report from the Trump administration comes out Monday. Yuan was 6.9222 Friday.
*****************************
| 10/5/2018 | 10/12/2018 | chg | |
| UST 2Y | 288.5 | 283.6 | -4.9 |
| UST 5Y | 307.1 | 299.3 | -7.8 |
| UST 10Y | 322.7 | 313.9 | -8.8 |
| UST 30Y | 339.7 | 331.6 | -8.1 |
| GERM 2Y | -51.4 | -56.0 | -4.6 |
| GERM 10Y | 57.3 | 49.8 | -7.5 |
| JPN 30Y | 94.1 | 90.6 | -3.5 |
| EURO$ Z8/Z9 | 59.5 | 51.5 | -8.0 |
| EURO$ Z9/Z0 | 5.0 | 3.0 | -2.0 |
| EUR | 115.23 | 115.60 | 0.37 |
| CRUDE (1st cont) | 74.34 | 71.34 | -3.00 |
| SPX | 2885.57 | 2767.13 | -118.44 |
| VIX | 14.82 | 21.31 | 6.49 |
https://en.wikipedia.org/wiki/Subprime_crisis_background_information

