Removing the Security Blanket
March 13, 2022 – Weekly Comment
From a BBG article:
“Asset purchases have been used as a blanket to smother the sparks of uncertainty in Europe for the last decade,” said Oliver Blackbourn, a fund manager at Janus Henderson Investors. “With a geopolitical shock of unknown length and intensity still on-going, markets have clearly been surprised by the ECB’s decision to start reducing this safety net.”
Bonds have been battered in a week that saw the ECB unexpectedly accelerate its wind-down of stimulus programs as well as reports of plans for massive debt sales by the bloc to fund energy and defense spending in the wake of Russia’s attack on Ukraine.
The ECB took a hawkish turn this past week with the German Schatz and bund both up about 32 bps; the bund ended the week yielding just under 25 bps. Italy 10s went from a high of 1.97% on Feb 14, to a low of 1.40 on March 1, back up to 1.90 after the ECB meeting. As can be seen on the ERM2/ERM3/ERM4 butterfly chart (82.5s), the near spread (ERM2/M3) exploded 38 bps on the week as the ECB shifted the market’s expectations to near-term tightening, echoing the US market with relative steepness in front followed by flatness or inversion in back. In the US, EDM2/M3/M4 is 120.5 (100.5 in EDM2/M3 vs -20.0 in EDM3/M4).
The Fed Effective Rate has been 8 bps every day of this year. April FF settled at 9966.0 or 34 bps, indicating a high degree of confidence that the FOMC will hike by 25 on Wednesday.
In the US, treasury yields went up similar magnitudes to Germany as the security blanket here is also being removed. 2s up 25 bps to 1.748, 5s up 32 to 1.958 and 10s up 28 to end at 2.00%. TYM2 posted an outside range week, making a high of 129-04 on Sunday night, and closing at the week’s low 125-30. The 10y 2% yield is once again just over the late 2019 pre-covid high. The copper/gold ratio appears a bit vulnerable to the downside, but if it holds the bottom of the past year’s range, would suggest a further leg up in the ten-year yield. The picture on yields remains bearish.
At the December FOMC, the SEP (Summary of Economic Projections) estimated 2022 GDP at 4.0% and PCE inflation at 2.7%. Clearly the latter will have to be raised, and the former, whether officially trimmed in the SEP or not, is too high. The Atlanta Fed GDP Now estimate for Q1 is just 0.5. According to Curinos (via twitter) “Feb 2022 mortgage rate-lock volume was down 41% yoy and 8% mom across all channels… The average 30-yr conforming retail funded rate in February was 3.63%, 24 bps higher than in January and 72 bps higher than the same month last year. Refi rates were 22 bps higher mom and 68 bps higher yoy.” The housing market and other interest-rate sensitive sectors are going to decelerate.

China continues to slow as well, with the Li Index at its lowest level since the pandemic as of the end of the year. Shanghai Comp is down 9% since the start of the year and Shenzhen Comp is down 14%. The increase in food and input prices is crimping the economy, along with the property sector implosion. No confirmation on this, but I have heard China is only manufacturing certain products three days a week due to rolling blackouts.
It’s somewhat interesting to note that crude oil (WTI) priced in gold is pretty much where it was through the middle 1990’s. I guess that’s another way of saying that the purchasing power of USD, even though DXY has been rallying, is under a cloud of suspicion, with gold more-or-less retaining its purchasing power. Gold is money.
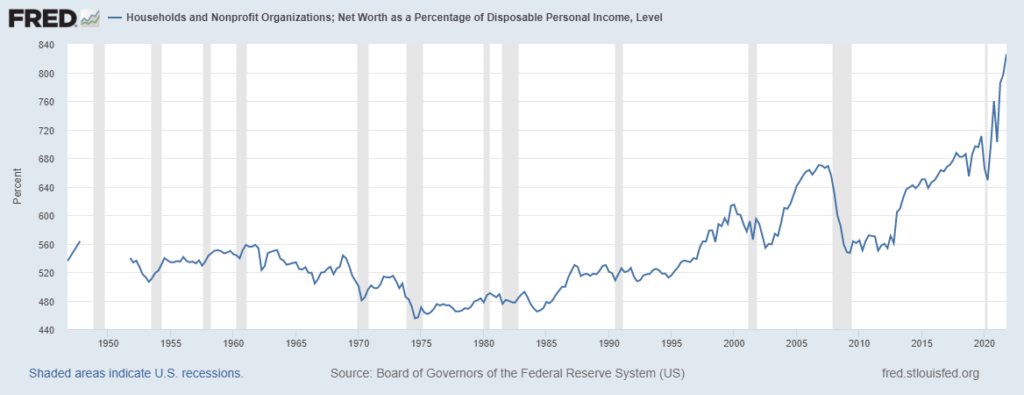
One could substitute “stocks” for “Europe” in the first line of this note. That is, “Asset purchases [and monetary policy in general] have been used as a blanket to smother the sparks of uncertainty in the US stock market for the last decade.” The Z.1 quarterly report from the Fed revealed that Household Net Worth ended 2021 at a record $150.29 trillion. The St Louis Fed website includes a chart on HH net worth divided by GDP, but data ends in 2014. However, a similar idea is this one: HH Net Worth as a percent of Disposable Personal Income. Chart below. The average from the 1950s to 1995 was about 550%. Last reading is a record 825%. If there’s such a thing as reversion to the mean, or even reversion to trend since 1995, US asset values are in for a large retrenchment.
OTHER MARKET THOUGHTS/TRADES
On Tuesday, there was a large new seller of EDZ2 9800/9750/9700 put tree for -2.0. That is, the 9800 puts were sold, and the 9750 and 9700 puts bought. Settled -1, or 45.0, 28.25, 17.75 vs 9804.5. That trade appears to have marked the peak reach for skew/downside. By Friday, EDZ2 settled 9794.0 and the put tree settled +3.75, or 45.75, 26.50. 15.50.
| 3/4/2022 | 3/11/2022 | chg | ||
| UST 2Y | 149.0 | 174.6 | 25.6 | |
| UST 5Y | 163.2 | 195.6 | 32.4 | |
| UST 10Y | 172.2 | 200.0 | 27.8 | |
| UST 30Y | 214.7 | 236.0 | 21.3 | |
| GERM 2Y | -73.0 | -40.7 | 32.3 | |
| GERM 10Y | -6.9 | 24.9 | 31.8 | |
| JPN 30Y | 84.2 | 87.3 | 3.1 | |
| CHINA 10Y | 282.4 | 279.5 | -2.9 | |
| EURO$ M2/M3 | 87.5 | 100.5 | 13.0 | |
| EURO$ M3/M4 | -26.5 | -20.0 | 6.5 | |
| EURO$ M4/M5 | -7.5 | -8.5 | -1.0 | |
| EUR | 109.35 | 109.15 | -0.20 | |
| CRUDE (active) | 115.68 | 109.33 | -6.35 | |
| SPX | 4328.87 | 4204.31 | -124.56 | -2.9% |
| VIX | 31.98 | 30.75 | -1.23 |

