Post Election and FOMC
November 10, 2024 – Weekly Comment
*******************************************
Following the FOMC’s 25 bp cut and Trump’s sweep, SFRZ4 closed on the low at 9557.5 or 4.425%. After Thursday’s Fed cut, EFFR is 4.58 or 9542. So SFRZ4 is only 15 away from EFFR. SFRZ4/H5 spread closed at a new high of -24 (9557.5/9581.5). Roughly looking at just one ease in Q1. FFG5, which captures Dec and Jan FOMCs, settled 9568.5 or 4.315%, just 26.5 bps under EFFR; 1 cut.
The table below is a bit hard to see, but focus on the red and blue shaded areas. The contracts are SOFR, for the first four years, whites, reds, greens, blues. The start date is October 16 (random start date, about 3.5 weeks ago). The red shade represents the lowest contract/highest yield on the strip: SFRZ4 (from 9566.5 to 9557.5). The blue shade is the peak price on the strip. One might roughly equate it to the terminal rate. As the peak (blue) moves closer in time, it gives a rough measure of how aggressive the Fed is going to be in terms of easing policy. A week ago it appeared, from this table, as if the Fed would be done easing in about a year and a half.

A couple of things to note. The peak on Oct 16 was the third red at 9671.5 or 3.285%. The next week on Oct 24 it had moved closer in terms of time, to the second red slot, (SFRH6) at 9651.5. On Oct 16 the spread from lowest to highest was -105 bps. On Oct 24, -90. On Friday, the peak contract moved all the way back to the third green, SFRU7, at a price of 9628 or 3.72%. The lowest/highest spread is just -70.5 and covers a lot more time. All contracts from SFRH6 to SFRH9 settled between 9622 and 9627.5. Rough terminal rate of 3.75%.
I hope the market is wrong, because that could bring a boring few years for SOFR. What does this limited data set tell us about market sentiment? Whether the Fed articulates it or not (and Powell speaks on Econ Outlook again on Thursday) it will be leaning against stimulus measures by the new administration and rates will generally be higher.
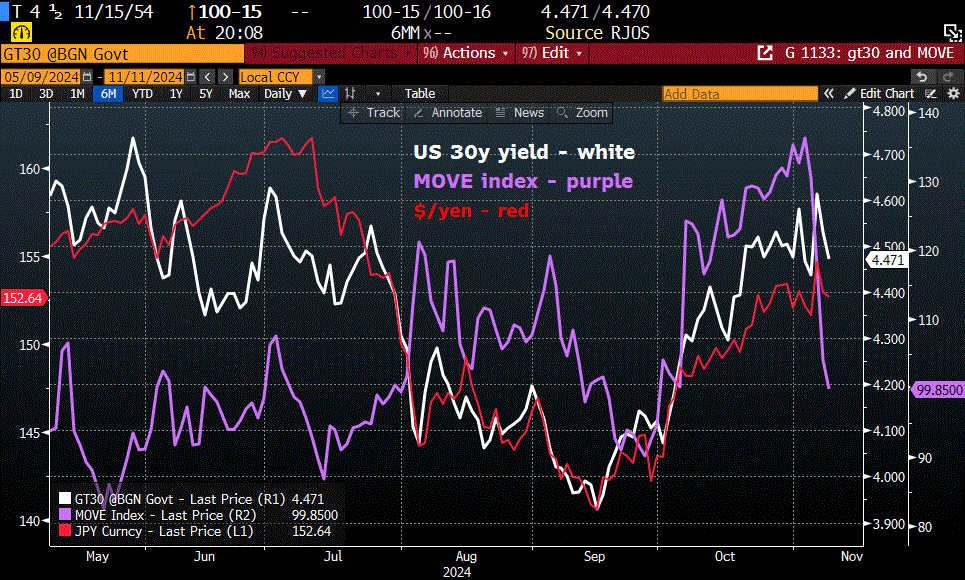
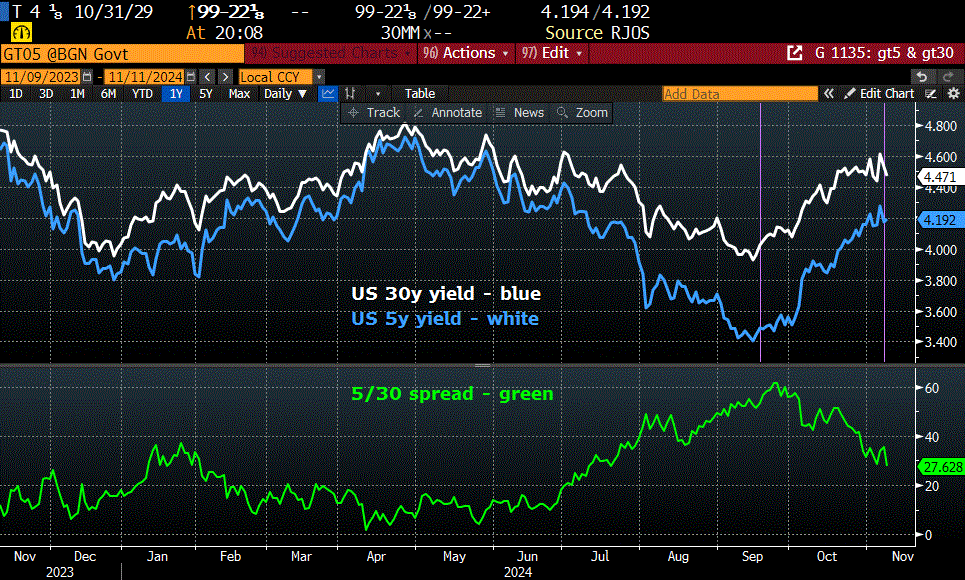
So why did the treasury curve flatten? I think a lot was vol/long put related. Consider the charts below. The top is over a six-month time frame. Since the FOMC on Sept 18, yields moved significantly higher. Market sentiment shifted to fears of unsustainable deficits and re-acceleration of inflation. Going into the election, bearish bets on the long end were expressed by heavy demand for puts. The huge rise in the MOVE index bears this out. With both the election and the FOMC decided, there was a huge decline in MOVE. Put liquidation. Which sparked a yield decline into Friday. The curve flattened as the Fed is expected to be in more of a wait-and-see posture. The chart on the next page shows that dynamic. Five-yr yield fell, but not nearly as much as 30s. Does the yield drop Friday portend a change in trend? Doesn’t look like it to me.

One other thing to notice on chart above: my friend Totman is always pointing out the correlation of $/yen to US yields. It’s obvious on the six-month chart, with $/yen in red. While global yields mostly fell late in the week, JGBs didn’t. Before the “yen-carry” debacle in early August, the 10y JGB had reached a high of 1.09 in July. In mid-August it hit 78 bps as the BOJ calmed the market, then chopped around before the latest run from 81 to 100 bps post-FOMC. Same with the 20y JGB: 1.94 in July, 1.62 right before the FOMC, now 1.83. $/yen in July 161.70. Just before Fed 140.62. Now 152.64. A further rise in JGB yields could siphon away some demand for USTs.
The chart below covers a one-year time frame and shows the 5y and 30y yields in the top panel, with the spread in the lower panel. Last two FOMC meetings marked with purple vertical lines. The 50 bp ease almost exactly marked the bottom in treasury yields. The spread declined/flattened. The market appears to be telegraphing a less accommodative Fed (just as the SOFR table above shows). Five-year note yield ended the week at 4.19%. Still about 40 bps underneath funding rates. However, SFRH5 is 9581.5 or 4.185% and SFRM5 is 9600.0 or 4%. If inflation stays around these levels and the Fed cuts a couple more times into Q2, then it will be a lot easier for the Treasury to place debt, as the US banking system will likely absorb a larger share of issuance.

News this week includes NFIB optimism on Tuesday…but this survey was done pre-election.
CPI Wednesday, PPI Thurs and Retail Sales Friday, but again, data may change quickly going forward. Powell speaks on Economic Outlook on Thursday.
The Fed’s quarterly Sr Loan Officer Opinion Survey (SLOOS) is Tuesday. The last report from July indicated modest tightening, though most banks/categories were unchanged. About 60 banks participate, 20 are large banks.
Home Depot (HD) reports on Tuesday. I was surprised to see a BBG article which says that same store sales have declined for 8 straight quarters (following the Covid surge). Pretty tough to do given inflation.
| 11/1/2024 | 11/8/2024 | chg | ||
| UST 2Y | 419.7 | 425.0 | 5.3 | |
| UST 5Y | 420.6 | 419.0 | -1.6 | |
| UST 10Y | 435.5 | 430.4 | -5.1 | |
| UST 30Y | 455.5 | 447.6 | -7.9 | |
| GERM 2Y | 224.7 | 218.5 | -6.2 | |
| GERM 10Y | 240.5 | 236.7 | -3.8 | |
| JPN 20Y | 177.7 | 183.1 | 5.4 | |
| CHINA 10Y | 214.3 | 210.7 | -3.6 | |
| SOFR Z4/Z5 | -67.0 | -60.5 | 6.5 | |
| SOFR Z5/Z6 | 1.0 | -7.5 | -8.5 | |
| SOFR Z6/Z7 | 2.5 | -2.0 | -4.5 | |
| EUR | 108.35 | 107.20 | -1.15 | |
| CRUDE (CLZ4) | 69.49 | 70.38 | 0.89 | |
| SPX | 5728.80 | 5995.54 | 266.74 | 4.7% |
| VIX | 21.88 | 14.94 | -6.94 | |

