Do Bond Yields Continue Higher?
January 12, 2025 – Weekly Comment
***************************************
I don’t believe the payroll data. However, there’s no doubt that the US economy has been resilient. In any case, the employment report (NFP 256k) bolsters the last Fed dot plot which ratcheted up inflation estimates. (PCE price estimate for 2025 in September was 2.1%, moved up to 2.5% in December). The bar has become quite a bit higher in terms of future Fed rate cuts.
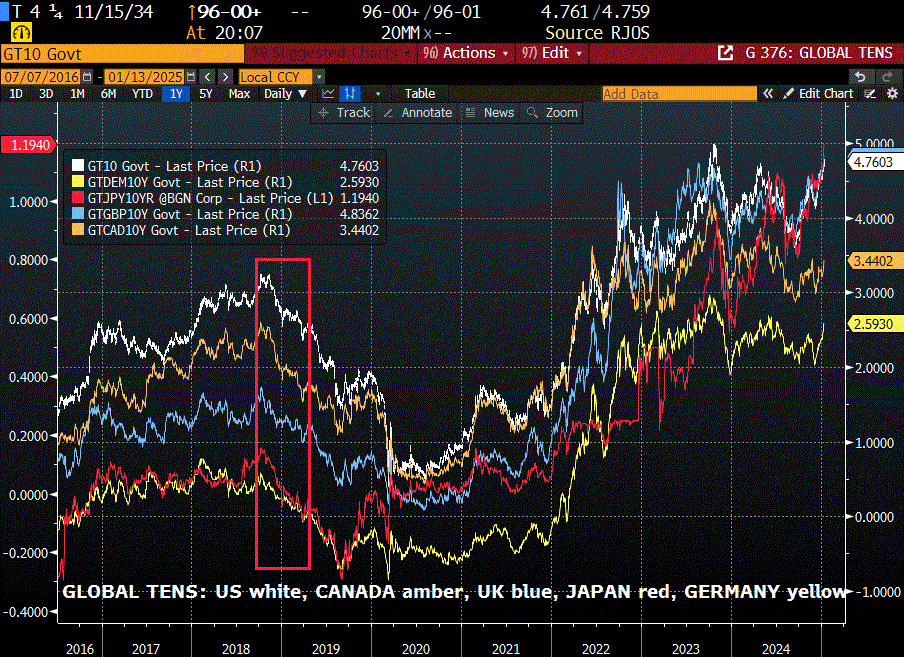
Above is a chart of global bond yields. New highs in Japan and the UK; the trend has been higher for all Western bonds.
What happened in 2018 to arrest the rise in global bond yields? (Red rectangle on chart). What I recall was a 20% drop in SPX from the start of October 2018 to the end of the year. Janet Yellen had taken tentative steps to raise the FF target from 0.25% to 1.25-1.50% by the end of her term. Powell became Chair in Feb 2018. From March to the end of September, FF (midpoint) went from 1.375% to 2.125%. Not a particularly large move, but at the same time QT was ratcheting higher. At the June 13, 2018 FOMC, the amount being shed from the Fed’s balance sheet was $40 billion per month. At the Sept 26 meeting it was increased to $50 billion. On October 3, Powell said “We may go past neutral. But we‘re a long way from neutral at this point, probably.” That was the pin. I think this time it was the December SEP.
On the below chart I highlight 2016 to the end of 2018, the initial Trump years. Just a few select data series: SPX in white, CPI in blue, FF (midpoint) target in red. A couple of things to notice: From the election in Nov 2016 to Jan 2018 SPX rallied 37%, then corrected as the euphoria from the tax package was exhaled. Powell came in with the intent to ‘normalize’ rates. QT and rate hikes at the same time. Even though stocks cratered in Q3 2018, the Fed hiked one last time in December, finally bringing FF back above CPI. Global bond yields fell for the next year. By the way, CPI high in 2018 was 2.9%, now 2.7%. PCE yoy Prices were 2.3% now 2.4%. Core PCE 2.0% now 2.8%

So what’s going on now? With PCE prices at 2.4% and FF at 4.33%, an argument can be made that we’re at neutral now, or perhaps a shade high. Inflation expectations have been moving up, for example, ten yr breakeven (Treasury minus TIP) has gone from 205 bps to 245 since the Sept FOMC. The LA wildfires are likely inflationary while adding to gov’t budget woes, and have caused massive wealth destruction. That loss of wealth will be plugged to some extent by the Federal Gov’t further pressuring debt dynamics.
From WSJ:
A Harvard Business School study found that expensive disasters in some parts of the country affect insurance rates in others, as insurers bump up premiums for homeowners in other areas to help cover big losses.
Probably didn’t need to go to Havard to figure that out.
The dollar index is making new highs (since late 2022). I would note that DXY was in rally mode in 2018 as well. For me, the question is: IF we get a significant stock market sell off, will bond yields begin to reverse lower? So far SPX has had a minor pullback of 4.3% since the early Dec high. The August pullback associated with yen-carry unwinding was 8.5%. A similar magnitude move from the Dec high of 6090 in SPX would be 517 lower, or 5575 (vs Friday’s close of 5827). A 20% decline off the December high is ~4875, which would essentially erase 2024 gains.
One other note with regard to QT. From the start of 2018 to the low in September 2019, the Fed’s balance sheet declined $680b from $4.44T to $3.76T, about 15%. Since the high in April 2022 of $8.96T it has declined to a current value of $6.85T, or $2.11T, nearly 25%. For Fibonacci enthusiasts, we’re just over a 38.2% retrace of the 2019 low to 2022 high.
The third paragraph of the last Fed Minutes addressed the timing for the end of balance sheet runoff. Currently, total bank reserves are $3.255T, more than 10% above GDP, probably at the tipping point of ‘ample’. I believe discussions to end runoff will be brought forward in a more urgent way at the Jan FOMC. Third paragraph of Dec minutes:
The manager also discussed balance sheet policy expectations. The average estimate of survey respondents for the timing of the end of balance sheet runoff shifted a bit later, to June 2025. This shift mainly reflected revisions to estimates by respondents who had expected balance sheet runoff to end in the last quarter of 2024 or in early 2025.
***********
On the week, the 5y yield jumped 17.8 bps to 4.59%, 10s rose 17.3 to 4.772% and 30s 14.4 to 4.963%. On the SOFR strip, SFRH5 down 6 to 9575, H6 -15 to 9587.5, H7 -22 to 9577.5 and H8 -25 to 9571. Back SOFR calendars steepened through the week but then flattened Friday with the stark realization that Fed easing could be over. On Friday the biggest loser on the SOFR strip was SFRM’26 at 9585, down 19, while SFRM’28 was only down 13.5 to 9569.5.
While the MOVE index ended the week higher, vols declined on Friday, indicating that long-end panic is subsiding. In the past few months, many heavy-weight traders warned about the long end in the US (Druckenmiller, Paul Tudor Jones, Gundlach, etc). The short bond trade isn’t necessarily ‘crowded’ but 10y yields have surged 110 bps since the Sept FOMC and 50 bp cut.
Recall it was October 2023 when Ackman spectacularly called the top in yields. From CNBC ‘Bill Ackman covers bet against Treasury, says ‘too much risk in the world’ to bet against bonds’ Key points were “…investors may increasingly buy bonds as safe haven because of growing geopolitical risks.” And “Ackman…removed the short because of concern about the economy.” Tens topped at 5% on Oct 19, and are now ¼% away at 4.76%.
Do bonds blow up due to bad budget dynamics, or become a port in the storm due to wealth destruction?
| 1/3/2025 | 1/10/2025 | chg | ||
| UST 2Y | 427.9 | 439.2 | 11.3 | |
| UST 5Y | 441.2 | 459.0 | 17.8 | |
| UST 10Y | 459.9 | 477.2 | 17.3 | |
| UST 30Y | 481.9 | 496.3 | 14.4 | |
| GERM 2Y | 216.1 | 228.4 | 12.3 | |
| GERM 10Y | 242.5 | 259.5 | 17.0 | |
| JPN 20Y | 188.2 | 195.9 | 7.7 | |
| CHINA 10Y | 162.1 | 165.3 | 3.2 | |
| SOFR H5/H6 | -21.5 | -12.5 | 9.0 | |
| SOFR H6/H7 | 3.0 | 10.0 | 7.0 | |
| SOFR H7/H8 | 3.5 | 6.5 | 3.0 | |
| EUR | 103.09 | 102.55 | -0.54 | |
| CRUDE (CLH5) | 73.21 | 75.75 | 2.54 | |
| SPX | 5942.47 | 5827.04 | -115.43 | -1.9% |
| VIX | 16.13 | 19.54 | 3.41 | |
| MOVE | 96.67 | 99.73 | 3.06 | |
Payroll Friday!
January 10, 2025
******************
–Payrolls today expected 165k with rate of 4.2%. LA fire damage now estimated $150B and going higher. Likely inflationary at the margin.
–On a half day there were some fairly large trades. In the long end, weighted to the downside. In SOFR there were some decent size call buyers.
[half day due to Carter’s Day of Mourning. Treasuries were closed]
The big trade was a new buyer of >50k TYG5 107.5/106.5ps for 11. Settled 12 vs 108-07.
SFRZ6 9700c 26 paid for 15k (new, settled 25.5 ref 9598)
SFRZ5 9650c 23 paid 5k (23.0s ref 9605)
SFRZ5 9625/9675cs vs 9525p 2.75 paid 8k for cs (new)
–Yields ended a bit lower with a steeper curve. Once again, new highs in deferred SOFR calendars. Reds +4.125 (9602.25), Greens +2.875 (9591.25), Blues +2.0 (9582) and Golds +1.875 (9573.25). On Wednesday I marked tens at 4.691%. This morning 4.698% ref 108-03.
–In yesterday’s note I mentioned SFRH6/H7 spread and SFRH6/H8 spread, both of which have rallied to highs since early Dec. Here’s a trade which appears profitable exit, synthetic sales of those calendars.
+0QH5 9587.5p cov 9606 34d (2x)
Vs -2QH 9587.5p cov 9597, 40d with 3QH 9587.5p cov 9587.5 50d
Ppr bought 0QH (6k) and sold 2QH and 3QH (3k each), took 10.5 credit
–Attached chart Baa yields and 30y mortgage. In late 2021 the 30y mortgage was approx 3% and Moody’s Baa Index was 3.25%. Now 30y BankRate Mortgage 7.08% and Baa is 6.14.
–Oaktree Capital, Howard Marks missive : Bubble Watch. Comprehensive and balanced warning signs. EVERYONE PANIC
https://www.oaktreecapital.com/docs/default-source/memos/on-bubble-watch.pdf?sfvrsn=ab105466_4

New high Gilt yields
January 9, 2025
****************
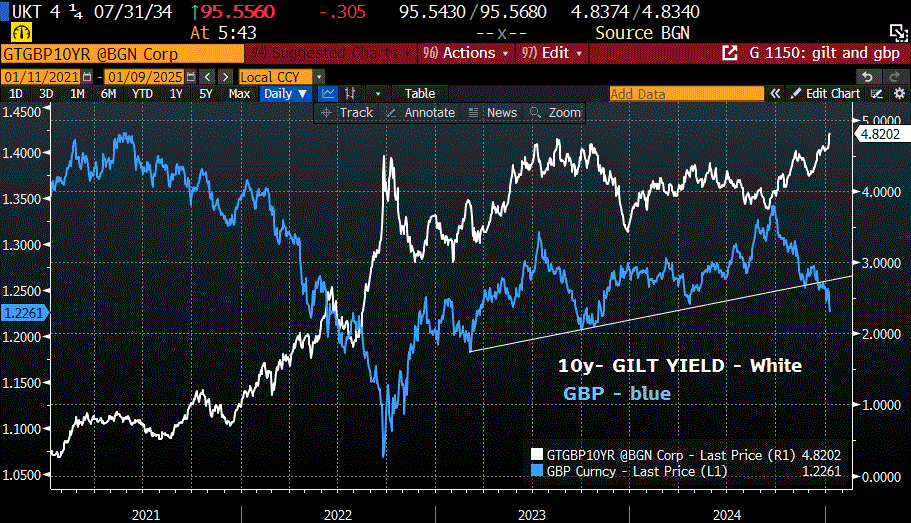
–UK assets continue to deteriorate, with 10y yield at a new high 4.83% and GBP 1.2260 (from 1.3440 three months ago). Gilt yield high was 4.75% in August of 2023.
–Estimate on BBG says LA fires could cause $57b in damage.
–US futures close at noon today in honor of President Carter.
–Waller leaned dovish. Looking for inflation to continue lower. Cites imputed prices for housing as a possible lagging indicator.
“If you look at the prices associated with the other two-thirds of core PCE, they on average increased less than 2 percent over the past 12 months through November. I don’t support ignoring our best measures of prices for housing and non-market services, but I find it notable that imputed prices, rather than observed prices, were driving inflation in 2024 and thus expectations of the policy rate path.”
- FED’S WALLER: LONG TERM YIELDS MAY HAVE MORE OF AN INFLATION PREMIUM, BUT SAYS FED WILL FIX THAT
– WALLER: U.S. DEFICITS MAY ALSO BE DRIVING LONG YIELDS HIGHER
–Not much net change in treasury yields yesterday. 10s ended at 4.691% up just under 1 bp. 30y holding above the high from last April (4.81%) current yield is 4.91%. High in October 2023 is 5.11%.
–On the SOFR strip deferred calendars continue to make new highs (curve steepening). The magnitude of moves is relatively small, but the direction is a tell. For example, SFRH6 is tied with Z5 as peak contract (price) at 9601.5. At the start of December, H6/H7 calendar was at a low of -12.5, now +9.5 (9601.5/9592). H6/H8 calendar went from -15 to +18.5 over the same time period (H8 at 9583). Another spread worth noting is 10y breakeven (10y yield minus 10y inflation-index tip). Since 2023 this spread has ranged from 250 bps to around 215, with a recent low in September of 203 (just prior to initial FOMC cut). It’s now 242.7 bps, threatening the upper end of the range. It will be hard to argue that inflation expectations are contained if this spread starts printing new highs.
–Consumer Credit isn’t a major release, but yesterday’s was an implosion. For November, Revolving Credit plunged $12.0 billion (though the month before it was +13.4b). In a broader overview, at the end of 2023 Consumer Credit (revolve and non-revolve) was $5.023.7T. As of November, it’s $5102.4T. Only eleven months, but the increase is only 1.6%. Below the inflation rate. As everyone is aware, delinquencies are growing.
This from Elliott Wave Theorist (I believe)
“According to The Council of State Gov’ts, just two state pension funds, Washington and S Dakota, are fully funded, leaving 48 states underfunded. Illinois and Kentucky are only 50% and 52% funded respectively, and that’s AFTER a long bull market. The next bear market will produce many disappointed pensioners.”
Rates higher…
January 8, 2025
*****************
…is it due to a whiff of inflation, or borrowing to buy Greenland?
–Data stronger than expected Tuesday with ISM Services 54.1 vs expected 53.5. Prices Paid were 64.4, highest in the past two years. JOLTS continued to rebound, up to 8098k. Treasuries were inspired to make new lows (price). High 30y yield 4.92%, new high since 5.115% in October 2023. Tens fell just short of 4.70%; high in April of last year was 4.706% according to BBG. The high in Oct 2023 was 4.992. At that time, the front TY contract was in 105 handle. 10/19/23 low of 105-10+. (There has been a good size buyer, 100k, TYH 106 puts recently).
–Key reversal by NVDA. New all-time high in the morning 153.13. Outside range day on solid volume; large range ($13) and closed on the low, 140.14. NVDA is the only one out of Mag7 to have posted an all-time-high (META is close). Last domino?
–Today’s news includes ADP expected 139k, Jobless Claims 215k. 30 year auction. Later in the day FOMC minutes and Consumer Credit.
More than 0DTE options, more than unlimited leveraged ETFs, and more than the GameStop saga, Fartcoin has become the financial asset manifestation of exactly what our market has become: Arkham Asylum, bursting at the seams with lunatics laughing like unhinged hyenas and unproductive assets chased by unsophisticated investors who, through the miracle of legalized sports betting, Robinhood, and “working from home”, have developed into full-on gambling addicts.
https://quoththeraven.substack.com/p/behold-the-era-of-fartcoins-majesty
Price action in rate futures remains bearish
January 7, 2025
****************
–30y bond exceeded last year’s high yield, printing 4.86% yesterday. marked at 4.835% at futures close (USH5 113-04s). In tens there was an early buyer of 50k TYH5 106p for 14, adding. Settled 15 vs 108-17. Open interest now 108k. The 106 strike is approximately 5% yield. Today tens are auctioned, followed by 30s tomorrow. New high in 2/10 at 34.2. On the SOFR strip, SFRZ5 was unch’d at 9602 and it’s now the peak contract price (along with H6 at 9602). From there, net changes were successively lower: Z6 -3.0 at 9597.5, Z7 -5.0 at 9592.0, Z8 -6.0 at 9586.5. Price action in interest rate contracts remains bearish.
–Today’s news includes Trade balance, JOLTS expected 7745k and ISM Services, expected 53.5 from 52.1.
Super Highways
January 5, 2025 – Weekly Comment
*************************************
First, a couple of Fed snippets which highlight a shift back to favoring the inflation mandate (as if the increased inflation dots in the last SEP were too subtle of a hint):
From Tom Barkin’s Fed speech on Friday, Jan 3:
- My baseline outlook is good. How economic policy uncertainty resolves will matter. But, with what we know today, I expect more upside than downside in terms of growth. I see more risk on the inflation side.
Basically, consumer strong but pickier. Jobs balanced, not as much firing and not as much hiring. Productivity gains.
… in my district [Richmond], there’s particular concern about the path forward for the federal workforce.
Second:
From a conference Saturday, both Kugler & Daly “stress inflation fight has not yet been won” (BBG)
****************
Kevin Muir, The MacroTourist, wrote in his latest post that some funds are changing their benchmarks rather than being shackled to performance (and portfolio percentages) of Mag7.
Behind the scenes, many compliance departments and other soberly inclined portfolio managers are questioning the wisdom of being benchmarked to an index that is so exposed to a single group of stocks. Many are choosing to change to a more diversified index.
https://themacrotourist.com/
The implication, depending on how large of a trend this becomes, is that less new money will be funneled into Mag7 and more into the broader market. Currently Mag7 is around 36% of SPX, vs 27% in 2020. (mkt cap Mag7: AAPL, AMZN, GOOGL, META, MSFT, NVDA, TSLA is $17.9T). Some might argue that compliance departments are also becoming heavily “overweight” with respect to the financial industry…
This is from a recent BBG story:
“The world’s 500 richest people got vastly richer in 2024, with Elon Musk, Mark Zuckerberg and Jensen Huang leading the group of billionaires to a new milestone: A combined $10 trillion net worth. [I calculated those three at ~$760 billion]
As a comparison, St Louis Fed has GDP as of Q3 at $29.4T.
What follows is sort of a planes, trains and automobiles comparison vs the information highway. DJT, no, not Donald J Trump but rather the Dow Jones Transports, surged on the election of DJT. From 16252 on Oct 31 to 17618 on Nov 29, a jump of 8.4%. However, as of Dec 31 it was all gone. In fact, on 12/29/23 DJT was 15899. On 12/31/24 it was 15896. No gain over the past year. Nada.
On 12/29/23 META was 354. On 12/31/24 it was 585, a gain of 65%. The market cap rose from about $925b to 1.528T, a rise of $603 billion. The market cap of all companies in DJT is $768b. Those 20 companies combined are worth half as much as Meta. According to slightly dated data on BBG, the DJT companies employ about 1.65 million people. META has 72k employees.
Now, here’s a snippet from Scott Galloway’s 2025 Predictions:
| The AI Company of 2025: Meta |
| No business is better positioned to register progress in AI than Meta. Nine out of 10 internet users (excluding China) are active on Meta platforms. The company has access to more unique human language data, i.e. raw training data, than Google Search, Reddit, Wikipedia, and X combined. In terms of compute, Meta has purchased more Nvidia Hopper GPUs (advanced AI hardware) than any U.S. company other than Microsoft, giving it unmatched AI training and deployment capacity. |
So, looking at things through the lens of Galloway, a technology expert, it’s about AI and tech stocks compared to each other, not to the broader market. Ignoring the stardust of AI, an X post by Daniel T Niles regarding META says in 2025, there is no election and no Olympics to provide a growth boost.
CONFLICT CONFESSION: I am personally short META calls vs long other tech company calls. Very small position.
The point is that 2025 may be the year of rebalancing. Out of tech and into ‘old economy’. Out of growth spurred by Federal Gov’t Deficits and into the private sector. Out of guns into butter. I have no idea whether the net shift will be up or down with respect to US equity markets, but at the margin, the Fed’s re-balance toward inflation rather than employment probably favors the latter.
OTHER TRADE THOUGHTS
My opinion is that the Fed’s 50 bp ease in September was partially sparked by volatility related to yen-carry on August 5. JPY is close to its level of early July just above 161, currently at 157.26. Low on Aug 5 was 141.70. Ten-yr JGB is near last year’s high, set in July, of 1.094% (current 1.085). Japan CPI is 2.9%. BOJ needs to hike. (another rebalance?)
FV to US vol ratio is near DV01 ratio. Last time I recall this happening was when inflation was picking up but the Fed was holding pat, i.e. the long end was leading both in terms of higher yield and higher relative vol. This time it’s more of a deficit scare. (DV01 ratio $124.70 USH v $42.00 FVH or 2.97. Vol ratio 11.85 to 4.14 or 2.86. Usually the vol ratio is more like 75% of DV01 ratio).
Gold SOFR contracts (5th year forward) appear too high in price (low in yield) relative to treasuries. My opinion is that the red/gold pack spread in SOFR is lagging 2/10 treasury spread. From mid-August to Sept 25, rolling red/gold SOFR spread rallied from 7 bps to 40.75 (up 33.75). Over the same period 2/10 rallied from -20 to +22, 42 bps. Since Nov 25, 2/10 from 0 to +31.5 (new high). Red/gold from -9 to +15 or up 24. Below is first gold to 10y yield, now at a spread of 50bps (nr lows).

Perhaps it’s the adjustment of reds lower (in price) without a corresponding move higher in the 2y yield. For example, on September 11, the yield on SFRH6 vs 2y was 84.5 bps (2s were 3.64% and SFRH6 was 9720.5 or 2.795%). SFRZ5 was essentially the same as SFRH6 so roll doesn’t account for more than a couple of bps. Currently 2s are 4.28% and SFRH6 is 9602.5 or 3.975%, a spread of 30.5 bps.
************************
Auctions of 3s, 10s and 30s ($58b, 39b and 22b) are Monday, Tuesday, Wednesday, moved forward due to the Day of Mourning for President Carter on Thursday. JOLTS on Tuesday. FOMC minutes Wednesday. Payrolls on Friday expected 160k, with Rate unch’d at 4.2%
Other upcoming events:
From the BLS:
Benchmark Release Date
The Bureau of Labor Statistics (BLS) will publish the annual benchmark revision to establishment survey employment data with the February 7, 2025 release of the January 2025 Employment Situation.
https://www.bls.gov/ces/publications/news-release-schedule.htm#:~:text=Benchmark%20Release%20Date,the%20January%202025%20Employment%20Situation.
From Yellen’s recent December 27, 2024 letter to Congress:
Treasury currently expects to reach the new limit between January 14 and January 23, at which time it will be necessary for Treasury to start taking extraordinary measures.
| 12/27/2024 | 1/3/2025 | chg | ||
| UST 2Y | 432.4 | 427.9 | -4.5 | |
| UST 5Y | 445.6 | 441.2 | -4.4 | |
| UST 10Y | 461.9 | 459.8 | -2.1 | wi 459.9 |
| UST 30Y | 481.0 | 481.5 | 0.5 | wi 481.9 |
| GERM 2Y | 210.0 | 216.1 | 6.1 | |
| GERM 10Y | 239.6 | 242.5 | 2.9 | |
| JPN 20Y | 189.5 | 188.2 | -1.3 | |
| CHINA 10Y | 170.1 | 162.1 | -8.0 | |
| SOFR H5/H6 | -17.5 | -21.5 | -4.0 | |
| SOFR H6/H7 | 4.0 | 3.0 | -1.0 | |
| SOFR H7/H8 | 3.5 | 3.5 | 0.0 | |
| EUR | 104.25 | 103.09 | -1.16 | |
| CRUDE (CLH5) | 70.18 | 73.21 | 3.03 | |
| SPX | 5970.84 | 5942.47 | -28.37 | -0.5% |
| VIX | 15.95 | 16.13 | 0.18 | |
| MOVE | 95.20 | 96.67 | 1.47 | |
Bond supply…then payrolls
January 3, 2025
******************
–Treasury auctions of 3, 10, 30y moved to Monday, Tuesday, Wednesday due to memorial day for President Carter on Thursday. Payrolls on Friday.
–Yields were lower yesterday morning to start the year but ended around unch’d with tens 4.573%. SOFR contracts -1 to +1.5 out to golds (5th yr). There was fairly heavy block activity in TY puts, looked to be rolls from Feb puts into long TYH 106p from TYG 108.5 and 107.5p. In any case, DV01 currently on TYH is $64.70 so against a settle of 108-26 vs 10y cash yield of 4.573, let’s call the 106 strike something like 44 bps away ~5%.
–Feb options peak open interest is 108.5p (33s) and 108p (21s) at 95k and 98k, with former down 9k and latter +21k. TYH5 106p settled 14 and open interest rose 44k to 60k (now the put strike with peak OI). Also a new buyer of 10k TY wk2 108p which settled 9.
–BBG reports after having defended 7.30 in CNY for a couple of weeks, China let it go, trading last at 7.3187. There’s also this snippet from Reuters:
RTRS BEIJING, Jan 3 (Reuters) – China will sharply increase funding from ultra-long treasury bonds in 2025 to spur business investment and consumer-boosting initiatives, a state planner official said on Friday, as Beijing cranks up fiscal stimulus to revitalise the faltering economy.
–SHCOMP lower again this morning as the year begins with a further unwind of the late Sept China stimulus package. I don’t know that Trump’s tariff plans are likely to be inflationary given stagnation and a weaker currency in China.

2/10 close 2024 at high of year, +32.7
January 2, 2025
*****************
–Thin conditions Tuesday to end the year. Yields edged a bit higher. I marked tens at 4.577%, up 3.4 bps on the day and up 70 bps on the year.
–Buyer 7.5k SFRZ5 9600/9650/9700c fly for 8.25. Settled 7.75 ref 9605.5. Also SFRU5 9650/9750cs bought 24k, vs sold 12k SFRZ5 9550p at 0.5 (cs settled 9.75, put at 16.5)
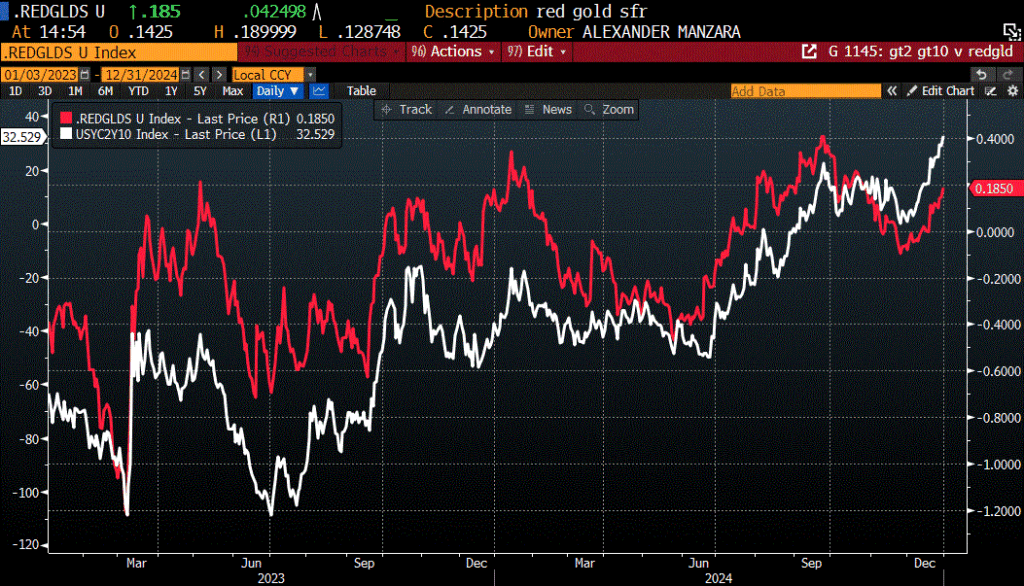
–2/10 treasury spread settled at the year’s high of 32.7. On the chart below, it’s the white line. I loosely watch red/gold pack spread as a proxy (in red on chart). The scales on the chart are not the same, but red/gold is lagging here. This is NOT a specific trade recommendation, just an observation. I will probably write up a trade rec today when I can check live option pricing.
From end of Nov, 2/10 went from -18 to +32, a jump of 50. Over same time frame, red/gold from -9.75 to +17.75; of course there was a contract roll, but the lag is evident using specific contracts. In looking at the move from early July to Sept 13, (just before the FOMC), 2/10 rose from -35 to +7 or 42 bps. Red/gold from -15 to +31 or 46 bps.
–News today includes Jobless Claims, expected 221k. I’m guessing they’ll be up to 250k by end of Q1. NOTE: next week we have 3/10/30 year auctions. Thursday is a half day to honor President Carter. BBG still shows auction time at 1pm for the 30y.
Bring on 2025
December 31, 2024
*********************
–Yields eased yesterday, with tens down 7.6 bps to 4.543%. Current is 4.52 (pre-open). Year’s range 3.62 to 4.71; the low coincided with the Fed’s initial 50 bp ease in mid-Sept. Tens are currently about 20 bps above the Fed Effective rate.
–BBG article this morning ‘Treasury’s $50 trillion Deluge Will Test Strained Dealer ‘Pipes’
“Issuance has gone up almost threefold in the last 10 years and the anticipation is for it to close to double to $50 trillion outstanding in the next 10 years, whereas dealer balance sheets haven’t grown at that magnitude,” said Casey Spezzano, head of US customer sales and trading at primary markets dealer NatWest Markets and chair of the Treasury Market Practices Group, the government-debt watchdog sponsored by the New York Fed. “You’re trying to put more Treasuries through the same pipes, but those pipes aren’t getting any bigger.”
–Unemployment is Jan 10. Half day now on January 9, in honor of Jimmy Carter. ISM Mfg is this Friday.
PRNewswire/ — CME Group, the world’s leading derivatives marketplace, has announced that it will honor the passing of former President Jimmy Carter by implementing an early close for agricultural, equity and interest rate markets on the National Day of Mourning on Thursday, January 9, 2025.
U.S. equity markets will be open until 8:30 a.m. CT on January 9. All U.S. equity options expiring on January 9 will be moved to expire on Jan 8.
Interest rates and agricultural markets will close at 12:15 p.m. CT on Thursday, January 9.
We can absorb delinquencies on credit cards. CRE?
December 30, 2024
********************
–Big trade Friday as stocks slid: New buyer of 50k SFRM5 9612.5/9662.5cs vs 9556.25p for 3.0 to 3.5 covered 9592. 9612.5c 13.0s OI +43.5k. 9662.5c 6.0s OI +54k. M5 9556.25p 4.0s, OI +42k. Spread settle 3.0 ref 9592.0 settle. Stocks are slightly easier this morning and SFRM5 is 9593.5.
—Curve steepened Friday with 2’s down slightly in yield, and 10’s up 4.2 bps to 4.619%. 2/10 spread ended at the high of the year 29.5 bps. Similarly, red/gold pack spread in SOFR at a new recent high of 14.0. Red pack ended -1.375 at 9597.125 and gold pack -5.375 at 9583.125. All SOFR contracts settled under 9600 or 4%. Peak contracts now SFRZ5 and H6 at 9599.
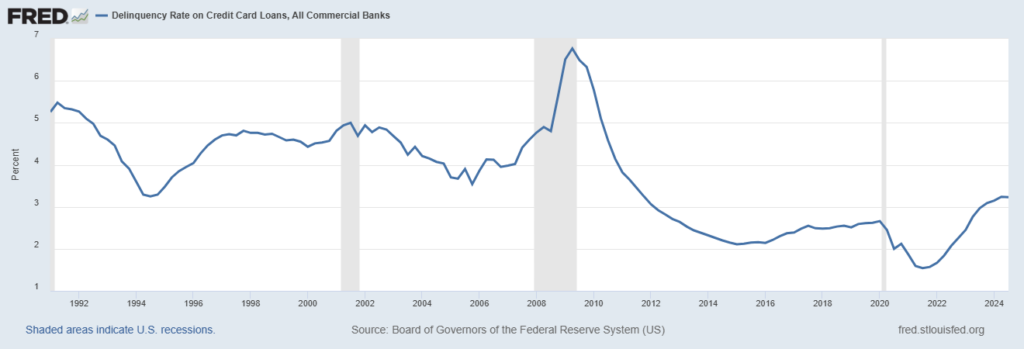
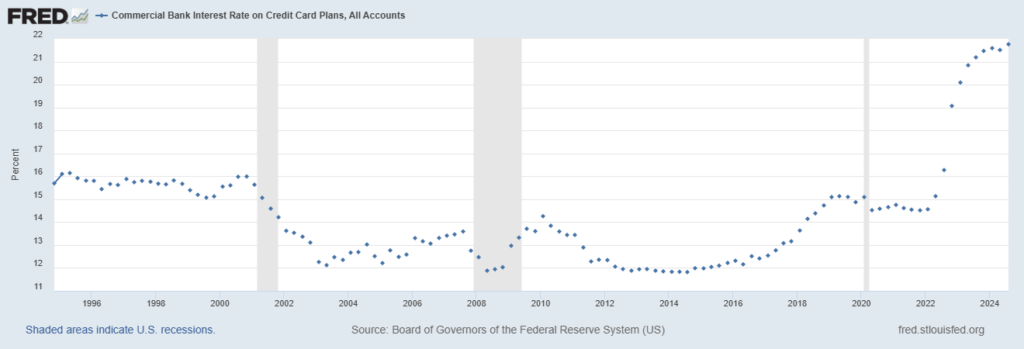
–Financial Times leads with an article ‘US credit card defaults jump to highest level since 2010’. Sounds ominous, but the default rate according to St Louis Fed is 3.23%. The interest rate charged on credit cards, all accounts, is 21.76%. Therefore, the spread is 18.5%. In 2010, the high interest rate was 14.25, so call it a spread of 11%. In other words, it doesn’t seem like a particularly big deal….for now anyways. If there’s a story here, it seems to me that whether it’s credit cards, mortgages, insurance rates, etc. the spreads seem to be extraordinarily high.
Below are St Louis Fed graphs of delinquency rates and credit card interest rates.
