ISM Mfg today, NFP on Friday
June 3, 2024
*************
—Vicious end-of-month squeeze in stocks Friday. In the last half hour ESM rocketed 65 points from 5242 to 5307 and is holding this morning at 5302.5 (+7.0 from settle). CLN4 just slightly lower after OPEC extended voluntary production cuts. US yields eased Friday with 10s down 4 bps to 4.512% (now 4.473). TYU4 settled 108-25+ and is currently 109-01+.
–ISM Mfg this morning, expected 49.6 from 49.2. Since late 2022 it has been sub-50 with the exception of a 50.3 print for March. Prices Paid expected 59.5 from 60.9 last. Prices have shown strength, having moved up from 45.2 at the end of last year.
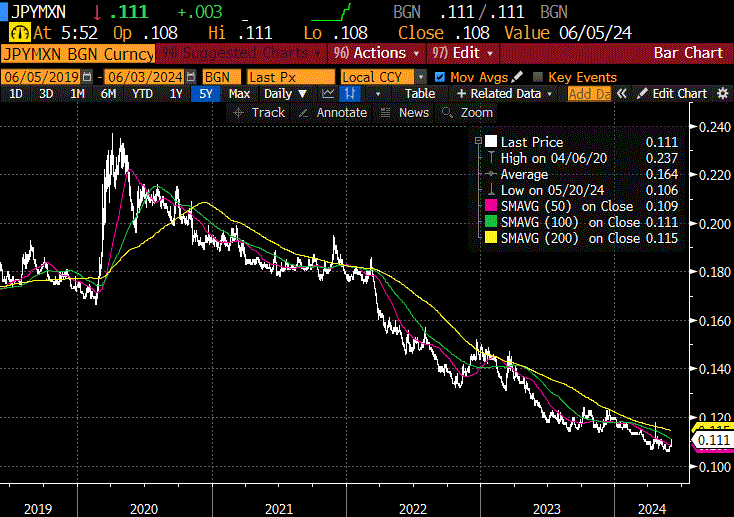
–On Friday John Deere (DE) announced layoffs and other operational cost saving moves, citing declining demand. Earlier in the year DE announced 684 layoffs across plants in Iowa and Illinois. DE is moving some production from the US to Mexico. MXN has generally strengthened against USD since covid, (from 24.00 to 16.26 this year) but it is weakening in the wake of Claudia Scheinbaum’s landslide win for President. I have also included a chart of JPY vs MXN…possible that MXN is turning here?
–ISM Services Wednesday. Payrolls on Friday expected 180 to 190k from 175 last. ECB fully expected to cut 25 on Thursday.
The Bell Tolls
June 2, 2024 – Weekly Comment
**********************************
In March 2007, an article in the WSJ cited problems at Bear Stearns’ subprime mortgage funds. In June 2007 Bear pledged a collateralized loan of around $3.2B to its sinking funds, the High Grade Structured Credit Strategies Fund and the Credit Enhanced Leverage Fund. By July 17, 2007, Bear reported that both funds were essentially worthless. They were ringing the bell.
A contemporary paper on that era’s credit crisis noted, “In the summer of 2006, it became clear that the subprime mortgage market was in stress. At this time, the ratings agencies issued warnings… Moody’s first took rating action on 2006 vintage subprime loans in Nov 2006.”
After a spirited 13% rally in 2H 2006, SPX pulled back in March ’07. Having ended 2006 at 1418, by July 13 it was 1552. A hard sell-off ensued on the ‘worthless’ news, but by October’07 SPX made a new high of 1576, as the Fed had cut 50 bps in September, from 5.25% to 4.75%. By the end of January 2008, FF had been slashed to 3% as stocks cratered. Incidentally, CPI was 3.4% in March 2006 (same as now) and peaked at 4.3% in June 2006. Thus began what is called the Great Financial Crisis.
Last Wednesday, Jamie Dimon said “There could be hell to pay” regarding private credit. “I’ve seen a couple of these deals that were rated by a rating agency and, I have to confess, it shocked me…”
Right on cue, BBG reported Friday: “Canadian investment mgr Ninepoint Partners is temporarily suspending cash distributions in three of its private credit funds, making it the latest lender to put a squeeze on investors to cope with a liquidity crunch.”
The largest of the three funds is Ninepoint-TEC, which reported C$1.2 billion in assets under management at the end of 2023. It makes asset-backed loans to companies that “may have difficulty obtaining financing from other sources” — and certain borrowers have the option of using a payment-in-kind structure rather than cash interest payments…So-called PIK loans allow a company to defer some or all interest payments until the debt matures.
The Ninepoint Alternative Income Fund, which has about C$600 million in AUM, has the bulk of its loans to middle-market companies in the U.S. and Canada. It normally targets payouts to investors of 10% to 12% of the average NAV in a calendar year, according to documents on Ninepoint’s website.
The firm is not winding down these funds… “Investors will continue to have access to the ongoing benefits of being invested in private credit as we remain focused on ensuring the sustained performance and stability of our current portfolio.”
Starwood has also gated funds. CEO Sternlicht last week wrote to investors in Starwood REIT that the firm would begin limiting redemptions, and Blackstone’s REIT has already done the same.
“Starwood founder Sternlicht said the change [gating redemptions] at the $9.9 B REIT, the second largest of its kind behind BREIT, is temporary. It is likely to be in place for 6 to 12 months ‘in anticipation of a lower interest rate environment and improved real estate capital market’…During the period of the amended share repurchase, he added, the adviser would waive the 20 pct management fee.
A BBG article cites a recent paper with this headline:
‘Big Banks’ CRE Exposure Rises 40% When REIT Debt is Factored In’ From the piece,
“Collateral damage to the largest banks from intensive credit line draw-downs means that systemic risk from total CRE exposure is probably much greater than if you only look at direct exposure,” said Manasa Gopal, an assistant professor of finance at Georgia Tech, who’s one of the report’s authors.
Ding. Ding. Ding.
The question of course, is whether these problems are systemic. Even if there’s conviction that they could be, the 2007 experience clearly illustrates that timing is important. Additionally, the retail public is conditioned by the financial news networks into the belief that Fed easing will solve, well, everything. What if the Fed’s already behind the curve and is steadfastly holding rates because it doesn’t want to appear political?
Below I post a couple of Eurodollar calendar spreads relating to the start of the GFC. Top panels show the contract prices and bottom panels are the constant maturity spreads. The hope is to help identify which spreads to favor, though this is just a cursory look.
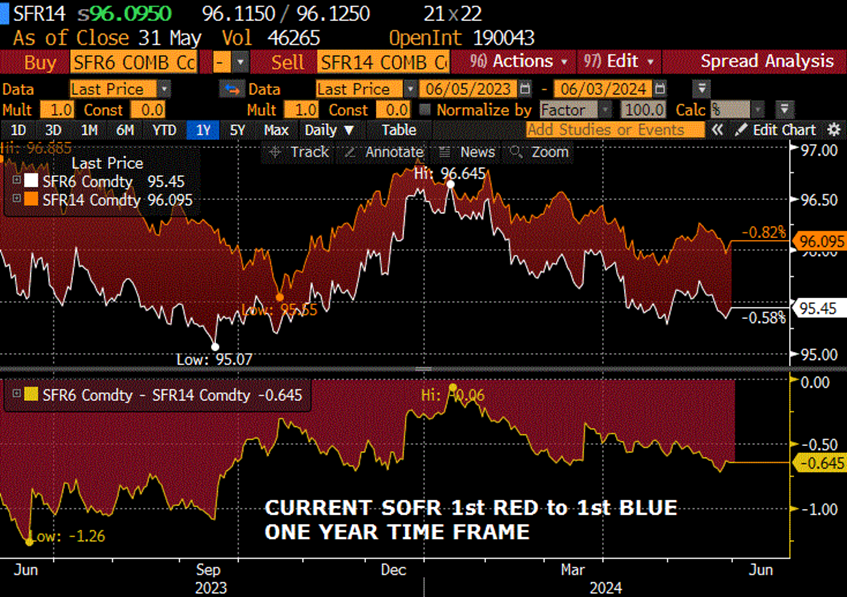
The first spread is ED5 to ED13, or the first red contract (5th quarterly) to the first blue (13th quarterly). Note that BBG changed the syntax with SOFR contracts, since the first contract continues to trade past the IMM date. That is, on the ED curve the first would have now been June (a forward period contract) and now SFR1 is considered March’24. So for a proper comparison look at SFR6 to SFR14 currently.
In any case, there are a couple of takeaways. First, the spread was positive throughout 2006 and 2007. Even with FF constant at 5.25% from July 2006 to mid-Sept 2007, the first red was pretty much capped at 9550 and the spread ranged from around 0 to +25. Currently the first red to first blue, SFRM5 to SFRM7 is -64.5 (9545/9609.5). The next spread, SFRU5/U7 is -47 (9563.5/9610.5). In a couple of weeks Sept will be first red to first blue. Secondly, futures contracts bottomed and the spread generally rallied from June/July 2007. So, from +33 at the end of June the constant maturity spread rallied to +177 by March’08. My suspicion is that June 2024 and beyond may end up resembling the playbook following June 2007.
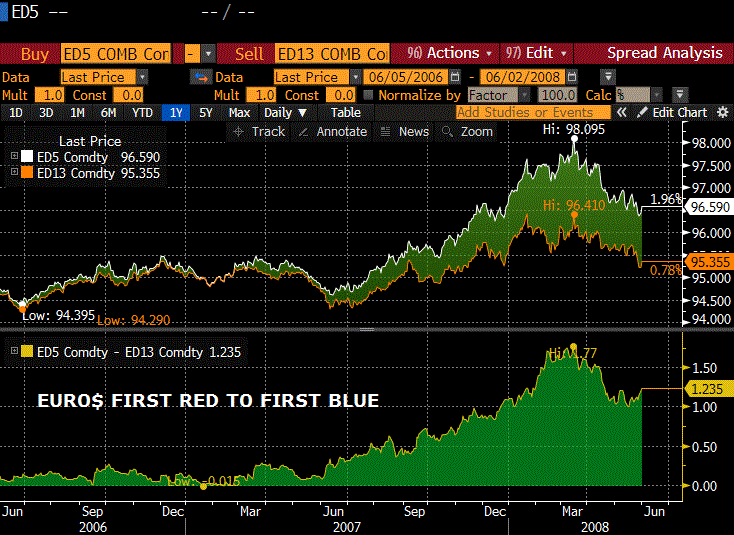
If that were to be the case, then buying the forward SOFR spread would be the correct strategy. That’s especially true given the severe inversion currently in place. However, there are mitigating issues this year, including the inflation fight and the election. So rather than buying SFRM5/M7 one might favor SFRU5/U7 (-47) or SFRZ5/Z7 (-32). I do favor a steepening trade, though there can obviously be quite a bit of volatility with this type of structure, and roll is a headwind. Additionally, in 2008 ED5 traded over 9800, or less than 2% yield. My belief is that the Fed no longer wants to push hard toward the zero bound, so reds may be limited on the upside, well below 9800.
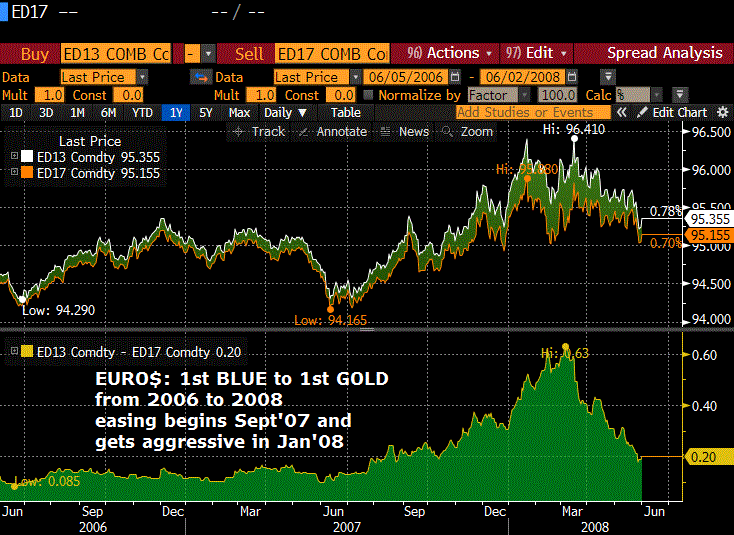
Below is the Euro$ chart, first blue to first gold, or the 13th to 17th contract from 2006 to 2008. Notice that in the year of a constant 5.25% FF rate (until Sept 2007) the spread traded in a pretty small range of +8.5 to +16.5. From the beginning of July 2007 to March 2008 it rallied 50 bps to +63. The first blue/first gold SOFR spread has been in a wider range this year, primarily between -1 and +17. It’s now at the low end of that range at +1.0 (SFRM7 9609.5 and SFRM8 9608.5). SFRU7/U8 is +2 (9610.5/9608.5). I could easily see a rally of 50+ bps in these spreads, relative to risk of about 10 from here.
| 5/24/2024 | 5/31/2024 | chg | ||
| UST 2Y | 494.8 | 489.1 | -5.7 | |
| UST 5Y | 452.9 | 452.6 | -0.3 | |
| UST 10Y | 446.6 | 451.2 | 4.6 | |
| UST 30Y | 457.1 | 465.2 | 8.1 | |
| GERM 2Y | 308.7 | 309.7 | 1.0 | |
| GERM 10Y | 258.3 | 266.4 | 8.1 | |
| JPN 20Y | 185.6 | 187.2 | 1.6 | |
| CHINA 10Y | 231.4 | 231.9 | 0.5 | |
| SOFR M4/M5 | -74.3 | -78.5 | -4.3 | |
| SOFR M5/M6 | -54.5 | -52.0 | 2.5 | |
| SOFR M6/M7 | -17.5 | -12.5 | 5.0 | |
| EUR | 108.56 | 108.48 | -0.08 | |
| CRUDE (CLN4) | 77.72 | 76.99 | -0.73 | |
| SPX | 5304.72 | 5277.51 | -27.21 | -0.5% |
| VIX | 11.93 | 12.92 | 0.99 | |
https://www.investopedia.com/articles/07/bear-stearns-collapse.asp
https://www.fdic.gov/analysis/cfr/bank-research-conference/annual-8th/turnbull-jarrow.pdf
https://blinks.bloomberg.com/news/stories/SE92EAT1UM0W
https://www.pionline.com/alternatives/canadas-ninepoint-partners-halts-cash-payouts-3-credit-funds
https://www.perenews.com/starwood-private-reit-gating-will-lead-others-to-consider-it
https://blinks.bloomberg.com/news/stories/SEAXI6T1UM0W
Inflation data today
May 31, 2024
**************
–News today includes the Fed’s preferred measure of inflation, Core PCE prices, yoy expected +2.8 same as last month. Headline expected 2.7, also same as last.
On a less important note (perhaps) Chicago PMI is released. Last at 37.9, it’s expected 41. The lowest print in the past 4 years was 37.8 in Nov 2022. If it doesn’t bounce, it’s another indication of weakness….like CRM, like Kohl’s, like Target, like Workday.
–Yields fell across the curve yesterday with tens down 7 bps to 4.562% and thirties down almost 6 at 4.684%. SFRM5 to SFRM8 +6.5 to 8.5. Felt like some trades were simply end-of-the-month liquidations. Not much reaction to Trump’s guilty verdict. Stocks generally weak. NVDA made a new high on an outside range and closed down 3.8%. Possible trend reversal.
Non-profits saw solid demand…oh great
May 30, 2024
**************
–Both stocks and bonds weak. 7 year auction tailed by 1.3 bps at a yield of 4.65% but treasuries stabilized post-auction. On the day, the ten year yield rose 8.2 bps to a new recent high of 4.622%. Treasury rolls have been substantially completed with heavy trade yesterday. Of course, June open interest has plunged in every treasury contract as expiration nears. I’m not sure if there is anything to read into this, but AGGREGATE open interest fell across UST contracts. I.e. September futures didn’t increase anywhere close to June’s losses (if data on prelim report is correct). For example, TYM OI fell 556k, but TYU only added 473k. UXYM OI fell 353k but UXYU only rose 272k. Somewhat strange given a move to higher yields, huge supply issues and a jump in implied vol. (TYU4 atm 108^ 2’32 or 6.0 vs Tuesday atm 108.5^ 2’27 or 5.7).
–Today’s news includes Q1 GDP 2nd estimate at 1.3% from 1.6% with Price Index 3.1% and Core 3.7%.
Jobless Claims expected 217k
PCE prices tomorrow.
–Large new sale of 0QU 9550^ 51.5/52. Settled 51.5 vs 9551.0 in SFRU5. Breakevens approx 4% and 5% with 106 days until expiry.
Exit buyer of 20k 0QM/2QM 9600 call spread for 4.5 to 5.0, paying up for the 2QM calls. As noted over the weekend, SFRM5/SFRM6 spread has continued to decline as reds bore the brunt of selling given the Fed’s insistence that rate cuts aren’t necessary in the short term. On May 1, M5/M6 was -44, on Friday the low was -54.5, though yesterday it settled -48.5. Being short 2QM 9600c was a bit close for comfort with SFRM6 settling 9583.
–Just a couple of cherry-picked lines from Beige Book: (they’re all doing it…I just admit it)
Retail spending was flat to up slightly, reflecting lower discretionary spending and heightened price sensitivity among consumers.
Wage growth remained mostly moderate, though some Districts reported more modest increases.
Contacts in most Districts noted consumers pushed back against additional price increases, which led to smaller profit margins as input prices rose on average.
Nonprofits and community organizations cited continued solid demand for their services… [ I don’t like the sounds of that one…]
Supply weighs on bonds
May 29, 2024
**************
–Yields rose yesterday as 2 and 5 year auctions underwhelmed. 5y was 4.54 pre-auction but tailed over 1 bp with a result of 4.553%. Ten year yield up 7.4 bps to 4.54%. New high this morning in 10y JGB yield, over 1.10%. Contributing to weakness was buying of 26k each TYN 108.5/111.5 strangle for 45 and 108.5/111.5 strangle for 38-40. TYN4 108.5p has a delta of -0.47, settled 36, with a fall in open interest of 34k contracts. TYU4 settled 108-195.
–7 year auction today, followed by Beige Book.
–The weekend of May 18 I suggested that the GME pop and crash indicated a lack of firepower by spec ‘bros’. My thought was to short online betting companies, which I did by buying DraftKing puts. The thesis appeared to be working, but was helped along yesterday as Illinois proposed raising its sports betting tax, which is currently 15%, to as high as 40% on adjusted gross revenue of sports gaming companies. DKNG fell 10.3%. I’ll bet it goes lower.
–In an attempt to keep up with worldwide mayhem, there were 42 shootings, 10 fatally in Chicago over the Memorial Day weekend (included a 5 year old girl). The network news show I happened to be watching said there were 11 fatalities last year, so this year represents a drop of 9%. Feel better now?
https://chicago.suntimes.com/crime/2024/05/27/memorial-day-weekend-2024-continues-violent-trend-28-shot-7-killed
0QU 9575/9550ps vs 9563, 26k sold at 13.0
SFRZ4 9518.75/9543.75cs vs 9501, 13d 5.0 paid 15k
TYU4 105/112 rr vs 109-000, 34d 5k call sold flat
0QU 9575/9625/9650/9700c condor 10 paid 5k
Late,,,heavy buying TYN strangles
108.5/111.5 strangle 38-40 paid 26k
108.5/110.5 strangle 45 paid 26k
108.5p settle 0’36
110.5c settle 0’06
111.5c settle 0’02
Short end yields under pressure, long end eases
May 28, 2024
**************
–Friday featured new recent lows in some curve measures. For example, 2/10 hit a new low for the year of -48.5 (though low in December was -53.6). 5/30 hit a recent low of 4 bps, not quite at April’s low of 1.7. On the SOFR strip, SFRM5/M6 posted a new low -54.5, down 1.5 on the day. This spread had a high print of +0.5 this year (January).
–Today’s news includes Consumer Confidence, expected 95.9 from 97 last. Speakers Cook and Daly. Kashkari says the Fed can take its time cutting rates; the economy has remained “remarkably resilient”. Treasury auctions both 2 and 5 year notes, followed by 2y FRN and 7’s tomorrow.
Link below is a dynamic chart showing the relative movements of Federal spending on interest payments and defense.
Later
May 27, 2024 – Weekly note
******************************
Japan 10y yield 1.00%, new high for the year. Was 61 bps on Dec 29, 2023. Now at the highest since 2012. The 20y yield is 1.856% also at a new high. Highest since 2011.
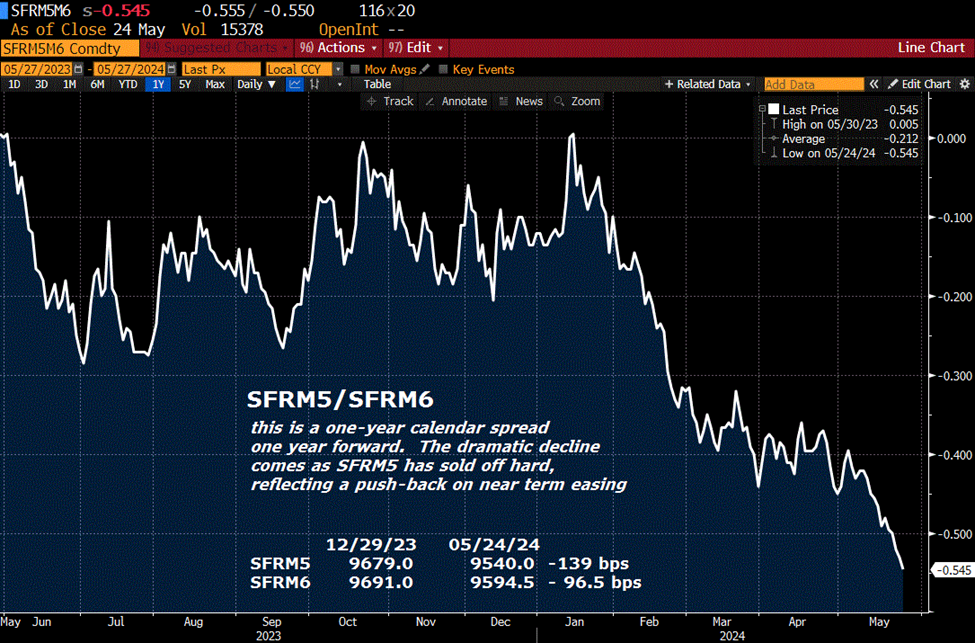
The weakest contract on the SOFR strip was SFRM5, down 17.5 on the week at 9540. On April 4, less than 2 months ago, SFRZ4 was 9542. That contract is now 9499.5. Roll down has been fierce given the context of steady (restrictive) Fed policy.
On Dec 29, 2023 SFRM5 was 9679.0, a decline of 139 bps on the year as easing expectations have been dramatically pared back. Chart below is SFRM5/SFRM6 which has fallen like a rock this year as reds have led the way lower.
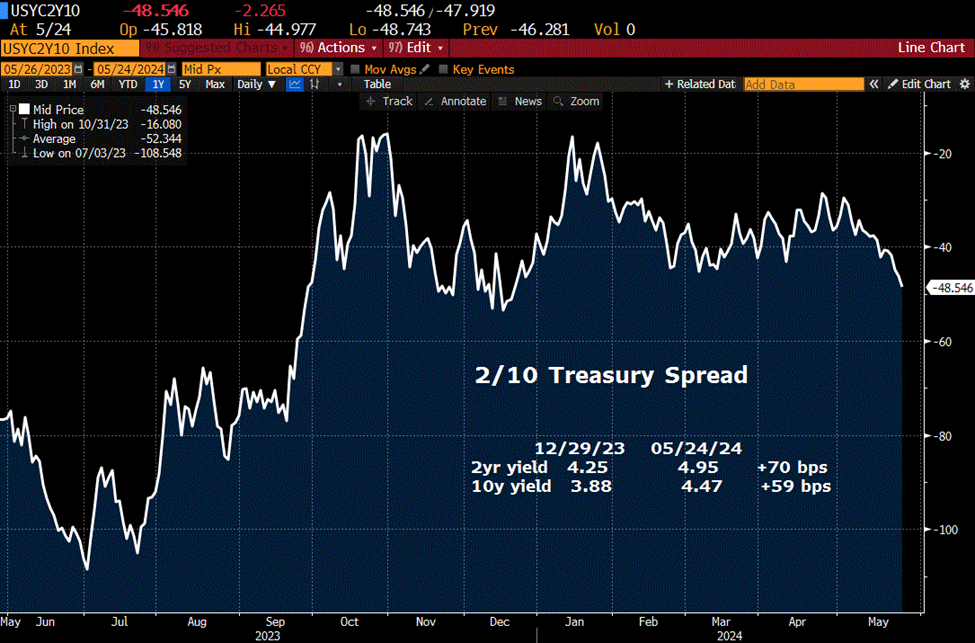
By contrast, the 2/10 constant maturity treasury spread has only gone from -37 bps on 12/29/23 to -48 currently. Of course, using constant maturity two-year doesn’t really capture the roll.
ECB expected to cut on June 6, with both Olli Rehn and Philip Lane citing disinflation trends. US Fed releases the Beige Book Wednesday. PCE prices on Friday expected 2.7% yoy with Core 2.8%, both same as last month. FOMC is June 12. July Fed Funds are 9467/67.5, exactly pegged to current EFFR of 5.33%, indicating near zero odds of an ease by the Fed. Closing arguments in Trump’s trial expected Tuesday.
Japan’s 20y yield rose 10.4 bps last week while the US 30y was up only 1.2 bps. Do more attractive yields in Japan portend a shift in capital away from US long end?
On Monday May 20, DJIA made a new high, posted an outside day, and fell into the end of the week. Following NVDA earnings, both SPX and CCMP (Nasdaq Comp) made new highs early, but had outside day ranges and closed lower (Thursday). Friday featured rebounds, but not to new highs. VIX ended the week at 11.93, stupidly low given possible reversal patterns in equities. Low risk entry for long VIX structures; exit on new highs in SPX and CCMP.
| 5/17/2024 | 5/24/2024 | chg | ||
| UST 2Y | 482.2 | 494.8 | 12.6 | |
| UST 5Y | 444.0 | 452.9 | 8.9 | |
| UST 10Y | 441.8 | 446.6 | 4.8 | |
| UST 30Y | 455.9 | 457.1 | 1.2 | |
| GERM 2Y | 298.6 | 308.7 | 10.1 | |
| GERM 10Y | 251.5 | 258.3 | 6.8 | |
| JPN 20Y | 175.2 | 185.6 | 10.4 | |
| CHINA 10Y | 231.7 | 231.4 | -0.3 | |
| SOFR M4/M5 | -88.3 | -74.3 | 14.0 | |
| SOFR M5/M6 | -48.0 | -54.5 | -6.5 | |
| SOFR M6/M7 | -12.5 | -17.5 | -5.0 | |
| EUR | 108.72 | 108.56 | -0.16 | |
| CRUDE (CLN4) | 79.58 | 77.72 | -1.86 | |
| SPX | 5303.17 | 5304.72 | 1.55 | 0.0% |
| VIX | 11.98 | 11.93 | -0.05 | |
Waller slow walking eases
May 21, 2024
***************
–Quiet session Monday with slight drift towards higher yields. Tens +1.7 bps to 4.435%. SFRU4 featured a couple of block sales at 9487 and 9486.5, settled 9486 with open interest down 21.7k so it appears to be liquidation. Buyer of 20k 0QH5 9475/9424ps for 4.75; settled 4.25 ref 9598.5.
–Several Fed speakers today but Waller is probably most important at 9:00am. Titles of his speeches on Feb 22 and March 27 were, ‘What’s the Rush?’ and ‘There’s Still No Rush’. Not likely to be a big change in tone with respect to easing.
–NVDA reports tomorrow. $2.3 trillion market cap. Friday’s 950^ appears to be around 83 ref 947.80.
–I will be out for the rest of the week.
Jokers and Thieves
May 19, 2025 – Weekly Comment
***********************************
Jokers and thieves
May 19, 2024
Alex Manzara/ Interest Rate Strategy and Execution/ amanzara@rjobrien.com
______________________________________________________________________
There must be some kind a way outta here
Said the joker to the thief
–Jimi Hendrix All Along the Watchtower
The youtube clip is a rendition of this song by Playing for Change, “…using music as a tool for education and social change around the world.” A lot of fantastic covers by this organization.
This week we had a brief resurrection of meme stocks. GME and AMC exploded in a starburst followed by flickering embers falling back to earth. Just an interesting market footnote, right? Maybe, but my theory is that the bros, or apes, or whatever they are called these days, are out of money (and ideas). I googled “investing apes” and was directed to the subReddit site WallStreetBets. Yup, Reddit is the site that AI will be mining. I guess we’ll see how it all works out.
In any case, the short squeeze in GME was short-lived this time. Why? My theory is that the first time around, there were government stimulus funds to burn through. And now…it’s gone.
So, what are the ramifications for interest rate futures? I think it means that US rates at the short end are likely to come down. But the market already reflects that, with heavily inverted calendars in short-rate futures. For example, SFRM4/SFRM5 closed -100 post-CPI before bouncing back to -88 to end the week. The high settle in SFRM5 on Wednesday was 9570.5 or 4.295%, still about 100 bps lower than the current Fed Eff rate of 5.33%. SOFR calendars have reflected the ebbs and flows of more or less easing, but have been continuously biased toward lower rates in the future since late 2022. Of course, new information can always impact perceptions of the future, though sometimes it’s just about flows. More on that below.
For example, Redfin says that the median home price hit a new record in April of $434k.. Whether that’s actually inflationary or not isn’t clear, but it doesn’t make one think of disinflation and rate cuts. However, the Redfin release also noted “18% of homes for sale in April had a price cut, up from 12% in April 2023.” Rick Rieder of Blackrock had an interesting take on Fed policy and inflation: he thinks cuts may actually cause inflation to recede. “I’m not certain that raising interest rates actually brings down inflation,” Rieder told Bloomberg’s David Westin… “In fact, I would lay out an argument that actually if you cut interest rates, you bring down inflation.” The reason has to do with the bifurcated economy. High rates help savers who can now afford to pamper themselves with more services due to large interest rate cash flows. Lower the cash flows (interest income) and lower the demand for expensive services. I love the example he gave: “The price of a pair of tennis shoes is what it was 20 years ago. If you go to a tennis match, it’s double what it used to be.” Honestly…who goes to a tennis match?
Anyway, the bros aren’t the ones with large savings earning interest. They’re the ones trying to show Wall Street fat cats who’s boss. And it didn’t work. Know what else the bros do? They bet on sports. (Probably not tennis, Rick). So, rather than ponder the complications of interest rate strategy, I went right to the source and placed a bet with long puts on one of the online gambling sites. I won’t say which one, but it’s not a casino company…a lot of those have a large Macau presence, and China’s stimulus measures might actually help those companies. No…I want to isolate the guy in the US who loves sports betting, but now is finding himself strapped for funds. No more easy short squeezes, no more job-hops for big raises. We’re now more likely to see advertisements of the sort that Rocket Money is running, to help CUT expenses by canceling subscription services.
I think the US consumer has turned, in a negative way, and that will feed into softer labor market data. However, the flows are a bit mixed. For example, on Friday there was a seller of 50k SFRH5 9600/9650c spreads (exit) at 6.5. Settled 6.0 ref 9535.0. Typically, when the Fed starts to cut, they move fairly quickly, but here’s a guy paring back on longs.
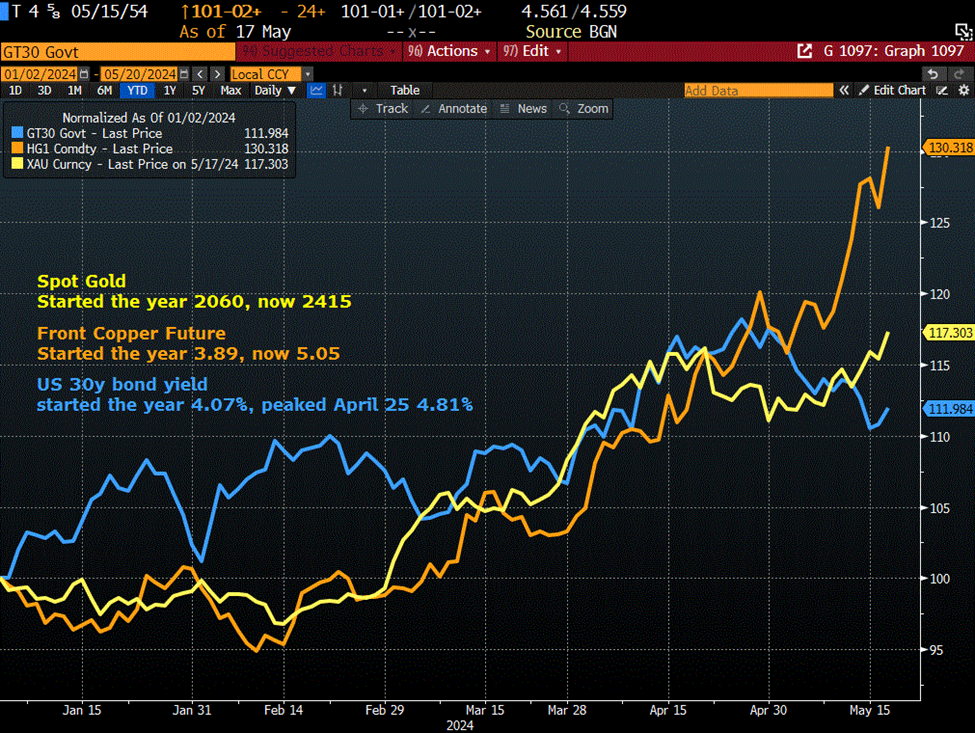
Another thought on flows. Last week’s TIC data showed a large decline in China’s Q1 holdings of US treasuries. From BBG: “Beijing offloaded a total of $53.3b of Treasuries and agency bonds combined in the first quarter.” Below are monthly changes in China and Hong Kong holdings of treasury securities in Q1, March, February and January, in billions:
China, Mainland -$7.6, -$22.7, -$18.6
Hong Kong -$10.3, -$16.0, -$5.7
That’s $48.9b for China and $32b for Hong Kong. Consider the chart below. The chart starts at the beginning of the year. What if it’s all about China’s flows? Selling US bonds (yields generally increased through Q1 into April), buying gold, and buying copper. Maybe the increase in US yields and the surge in commodity prices have little to do with forecasts of future inflation, but simply reflect China’s portfolio shift. From a Thursday BBG article: “China sold a record amount of Treasury and US agency bonds in Q1, highlighting the Asian nation’s move to diversify away from American assets as trade tensions persist.” Also from BBG regarding China’s sale of 1 trillion yuan ($138 billion) ultra -long special sovereign bonds:
“Bonds with 20-year and 50-year tenors will be offered from May 24 and June 14, respectively. Auctions of the securities will continue until a final batch consisting of 30-year notes goes on sale in November.” China’s 10y yield was over 2.7% in November and is now 2.3%. China looks to be locking in low rates for long-term financing (taking out a mortgage to buy unsold homes) while Yellen borrows short, at the highest end of the US rate curve spectrum. Jokers and thieves.
Should be a quiet week, with little US data coming out before the Memorial Day weekend. I will be out next week.
| 5/10/2024 | 5/17/2024 | chg | ||
| UST 2Y | 486.6 | 482.2 | -4.4 | |
| UST 5Y | 451.6 | 444.0 | -7.6 | |
| UST 10Y | 450.2 | 441.8 | -8.4 | |
| UST 30Y | 464.4 | 455.9 | -8.5 | |
| GERM 2Y | 296.7 | 298.6 | 1.9 | |
| GERM 10Y | 251.7 | 251.5 | -0.2 | |
| JPN 20Y | 169.2 | 175.2 | 6.0 | thru Oct’23 high |
| CHINA 10Y | 232.0 | 231.7 | -0.3 | |
| SOFR M4/M5 | -82.5 | -88.3 | -5.8 | |
| SOFR M5/M6 | -43.0 | -48.0 | -5.0 | |
| SOFR M6/M7 | -12.5 | -12.5 | 0.0 | |
| EUR | 107.72 | 108.72 | 1.00 | |
| CRUDE (CLN4) | 77.84 | 79.58 | 1.74 | |
| SPX | 5222.68 | 5303.17 | 80.49 | 1.5% |
| VIX | 12.55 | 11.98 | -0.57 | |
Game over
May 17, 2024
**************
–Pressure continues on both the curve and vol. New recent low in 2/10 spread at -41.4 (2y 4.789, +5.5 and 10y 4.375. +2.1). Red/green SOFR pack spread also edged to a new low at -31.25 (reds 9585.875, -7.375 and greens 9617.125, -4.5). With Fed officials throwing cold water on the prospects of near-term ease in the context of a slower economy, price action makes sense, in the short term anyway.
–Continuous efforts to support the Chinese economy (new plan to buy unsold homes) has rocketed the Hang Seng from 16k to 19.5k in just the past month. On the other hand, the flash rallies in GME and AMC have likely already run their course, perhaps a sign that the speculative public doesn’t have the same firepower that it did following gov’t stimulus checks. Not much pullback in copper though; critical inputs to the economic industrial machine probably deserve more attention than meme stocks
–Waller speaks today on payment innovations at 9:15. Probably no policy pronouncements, though if there are, no reason to suspect he’d change his HOLD STEADY stance. Kugler and Powell speak at commencement addresses this weekend.

