NFP – Happy 4th!
July 2, 2020
–Employment report today with NFP expected 3.058m. Currently stocks are positive and yields have edged slightly lower from yesterday’s settle, the dollar is lower. Mfg ISM released Wednesday showed a move back into expansion at 52.6, while Prices paid was also stronger at 51.3 vs 44.6 expected.
–Fed minutes had little effect on the market aside from solidifying the idea of low rates for a long time. That’s fairly evident from the euro$ curve as all contracts from EDU20 to EDZ22 are between 9970 and 9982. July midcurves expire one week from tomorrow and 2EN 9975 straddle settled at just 4.5 vs EDU2 at 9975.5. Though jobless claims and ADP have had violent swings, the market is priced for nothing to happen in the front end with today’s data. I’ll just note midcurve Sept atm straddles (72 dte): both 0EU and 2EU are 12.5 (vs 9982 in U21 and 9975.5 in U22) while the 3EU is 18.5. Of course the latter is at the 99.625 strike vs EDU3 at 9960.5. That is, the straddle is 1.5 times the premium of the nearer ones, but the strike of 37.5 bps is 1.5 times the 25 bp strike represented by the first two.
–St Louis Fed’s Bullard said that another flare-up of virus could spur a “wave of substantial bankruptcies” and of course, that’s exactly what we’re seeing. On a much shorter time frame, I can’t help but think the geopolitical situation could lead to weekend risk, especially on this 3-day weekend symbolizing US independence.
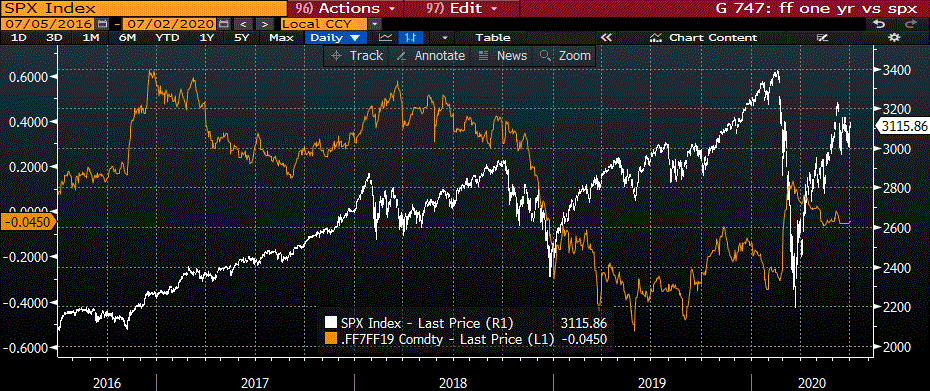
–There’s a post on ZH citing JPM’s Panigirtzoglou, that the Fed risks slipping behind the curve in terms of stimulus. (The Fed is already monetizing almost all US treasury issuance). I only skimmed the note so am probably not doing it justice, but he cites the forward 1y to 2y OIS curve – which is flattening and near inversion – as a risk to stocks. In yesterday’s note I mentioned that on the dollar curve EDM1/EDM2 which had settled 12 a couple of weeks ago had flattened to 2.5 (settled 3.5 yest). The attached chart shows the forward one-year FF calendar from 7 contracts out to 19 contracts out, currently Jan’21 to Jan’22, with SPX overlaid. I see no evidence of causation in this chart. In fact it seems the typical case is that as the short end of the curve flattens it helps stocks as the Fed is expected to lean more towards dovishness than hawkishness.


