Nearly priced for peak terminal
February 19, 2023 – Weekly comment
From February 2 on, the Fed Effective rate has been 4.58 except for one print at 4.57. If the Fed hikes 25 in March the new EFFR should be 4.83, if 50 then 5.08. April FF, which prices for the March 22 FOMC, made a new low this week, printing 9512.0 or 4.88. I think of that as a 20% chance of a 50 bp hike in March vs 25. FFJ3 settled Friday at 9513.5, but the contract low has been 9485 or 5.15 on November 4. The lowest contract on the FF strip is August’23 at 9470.5.
We’ve had several hawkish data prints recently, starting with the big NFP, then CPI, then this week’s Retail Sales and PPI. Recent Fed speakers have all tilted toward continued restraint, including Mester, Bullard, Bowman and Logan.
Markets have adjusted accordingly, with new lows in front SOFR contracts: SFRM3 settled at a new contract low 9472.0 and SFRU3 at a new low of 9474.0, both around 5.25%, versus the current FF target of 4.50-4.75%. I marked 2/10 as low as -86, though it printed -92, and ended the week at -79.7. These are the lowest levels since the early 1980s. The red/gold euro$ pack spread ended Friday at -75.625, just above the all-time low of -91 made in December. Both the 6m and 12m bills yield just over 5%. I saw a clip that said SP500 earnings yield is approx. 5.08%, the lowest spread to 6m bills since 2001. Below is a chart of SP Div yield and one-year t-bills.
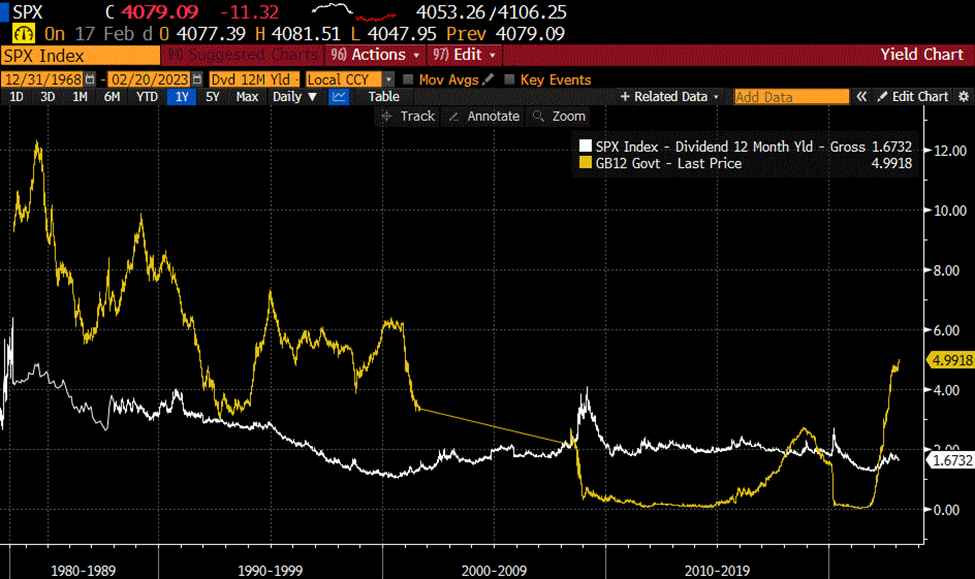
Obviously the above notes don’t mean that front end yields won’t go higher, however, it’s also clear that there have been some large market adjustments. In addition, short term yields have become strong competition to stocks, especially in an uncertain environment.
Here’s an excerpt from the NY Fed’s HH debt and Credit Report, Q4, emphasis added.
Total household debt rose by $394 billion, or 2.4 percent, to $16.90 trillion in the fourth quarter of 2022… Credit card balances increased by $61 billion to reach $986 billion, surpassing the pre-pandemic high of $927 billion; mortgage balances rose to $11.92 trillion, auto loan balances to $1.55 trillion, and student loan balances to $1.60 trillion. The share of current debt transitioning into delinquency increased for nearly all debt types .
It’s hard to tell when increased delinquencies become a problem. In part, new deals at higher rates probably help to cushion the blow of missed payments. The problem is that the realization that delinquencies are hitting critical mass can happen all at once.
In that connection, the return of 50-cent to VIX options is notable. Last week there was a buyer of 100k May VIX 50 calls for 0.50. Open interest in the strike is now 218k, ended Friday at 0.57. In nearer maturities, the 40 calls have large amounts of open interest: 220k in March 40c which ended at 0.31, 104k in April 40c which ended 0.61 and 286k in June 40c, ended 1.05. Spot VIX is 20.20, March 21.25, April 21.95, May 22.25 and June 22.55. An old BBG article estimated that after a year of patiently paying around 50 cents for VIX calls, the bet paid off in February 2018 with a $400 million surge. In 2017 VIX ranged from 9 to 15, in early Feb’18 it surged to 37.
Cem Karsan (@jam_croissant) opines that Carl Icahn has become active in buying ESH puts, paying about 31 for 23.5k ESH3 3950 puts on Tuesday, and another 12k ES Feb 21 expiry 4050p on Thursday. ESH3 3950p settled 37.0 on Friday vs 4087.50.
My thesis is that a hard and unexpected break in stocks will likely cause participants to trim back expectations for near term hikes. We don’t know when/if that will occur, but there seem to be some patient option buyers related to equities, just in case.
OTHER THOUGHTS/ TRADES
Clear exit trades occurred in rate options last week; unwinding of profitable bets for higher rates. For example, there were two block sales in 0QM3 9550p during the week, 46k at 24.5 vs 9573.0 in SFRM4 and another 46k at 21.0 vs 9579. Original buys started right on the Feb 1 FOMC, paying 5.0 ref 9661.0. On Feb 7, open interest in that strike peaked at 262k. On Friday OI has half that amount at 132k. It appears as if selling pressure is being used as an opportunity to exit bearish bets.
| 2/10/2023 | 2/17/2023 | chg | ||
| UST 2Y | 451.1 | 462.1 | 11.0 | wi 459.5 |
| UST 5Y | 392.6 | 403.3 | 10.7 | ‘wi 400.5 |
| UST 10Y | 374.5 | 382.4 | 7.9 | |
| UST 30Y | 382.7 | 388.2 | 5.5 | |
| GERM 2Y | 276.0 | 287.7 | 11.7 | |
| GERM 10Y | 236.4 | 244.0 | 7.6 | |
| JPN 30Y | 158.4 | 148.3 | -10.1 | |
| CHINA 10Y | 289.2 | 289.0 | -0.2 | |
| SOFR H3/H4 | -52.5 | -39.0 | 13.5 | |
| SOFR H4/H5 | -114.0 | -112.0 | 2.0 | |
| SOFR H5/H6 | -16.0 | -22.5 | -6.5 | |
| EUR | 106.79 | 106.96 | 0.17 | |
| CRUDE (CLJ3) | 79.92 | 76.55 | -3.37 | |
| SPX | 4090.46 | 4079.09 | -11.37 | -0.3% |
| VIX | 20.53 | 20.02 | -0.51 | |

