Missed Me
July 14, 2024 – Weekly Comment
***********************************
Post-debate a client had mentioned that the possibility that a Trump win could lead to a Fed HIKE. I dismissed that idea, but after yesterday’s assassination attempt on Trump, perhaps that scenario deserves small odds. The hike part that is, the other is becoming more of a given. Amazingly enough, I had just received one of those “your memories from this day” emails with this particular chart:
I don’t know that Small Business Optimism necessarily translates to economic dynamism. And, the initial plunge in 2020 was likely more associated with Covid than Biden. However, since the middle of 2022, NFIB has never been able to get above 92; this year’s range is 88.5 to 91.5, well below Trump’s average of 104 to 105.
In the week that just passed, Powell leaned slightly dovish in his semi-annual Congressional testimony. A monthly CPI print of -0.1 (3.0% yoy) supports the narrative that inflation is moving sustainably toward target. Focus has shifted to the labor market. An ease for September is now fully priced, with October Fed Funds settling 9492.5 or 5.075% just more than 25 bps below the current EFFR of 5.33%.
As the market gains confidence for near term easing, the back end of the curve steepened. 2/10, which hasn’t been positive since the middle of 2022 (the first hike was in March 2022) closed at -27 (4.462 / 4.187). The ytd low was -50 just three weeks ago on June 25. There should be resistance at -16, a double top from Oct 2023 and January of this year. A close above that level would suggest a target of +20 to +25. I expect that stimulative measures associated with a Trump win would lead to more pressure on the back end of the curve. On the other hand, the current administration has every incentive to juice the economy right NOW. At the end of the month the Quarterly Refunding Announcement could again favor bills over coupons (as it did in Oct 2023, helping to ignite an ‘everything’ rally). The TGA is currently $722 billion. From Q3 2022 to May 2023, it was drawn down from $690b to $48b. I’d wager we will see a rapid drawdown in the next few months, pumping direct fiscal stimulus into the veins of the US economy.
I am simply adding a couple of other charts of interest. The first is the ‘Buffet indicator’ of total US Market Cap to GDP. It’s hard to see on the chart, but it is now at a record 196%.
https://www.longtermtrends.net/market-cap-to-gdp-the-buffett-indicator/
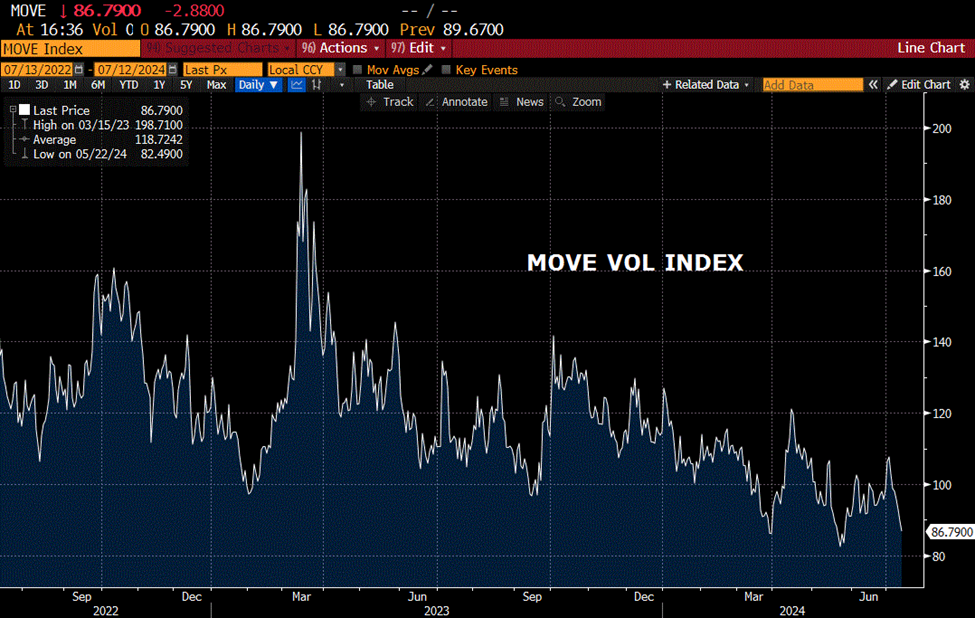
Second, here is a chart of the MOVE index, a measure of implied volatility in treasuries. It ended the week near the low of the year, as yields eased in the context of a steepening curve with inflation concerns receding. VIX similarly closed near the low of the year at 12.46; in fact it’s near the post-covid low. Insurance is cheap.
| 7/5/2024 | 7/12/2024 | chg | ||
| UST 2Y | 459.7 | 446.2 | -13.5 | |
| UST 5Y | 421.6 | 411.1 | -10.5 | |
| UST 10Y | 426.9 | 418.7 | -8.2 | |
| UST 30Y | 446.7 | 440.1 | -6.6 | |
| GERM 2Y | 288.9 | 282.3 | -6.6 | |
| GERM 10Y | 255.6 | 249.6 | -6.0 | |
| JPN 20Y | 193.3 | 187.0 | -6.3 | |
| CHINA 10Y | 227.3 | 225.9 | -1.4 | |
| SOFR U4/U5 | -114.5 | -128.0 | -13.5 | |
| SOFR U5/U6 | -34.5 | -30.5 | 4.0 | |
| SOFR U6/U7 | -4.0 | 0.5 | 4.5 | |
| EUR | 108.40 | 109.08 | 0.68 | |
| CRUDE (CLU4) | 82.26 | 81.02 | -1.24 | |
| SPX | 5567.19 | 5615.35 | 48.16 | 0.9% |
| VIX | 12.48 | 12.46 | -0.02 | |

