Mid-August musings
August 13, 2023 – Weekly Comment
**************************************
I like to keep my issues strong
It’s always darkest before the dawn
–Florence and the Machine – Shake It Out
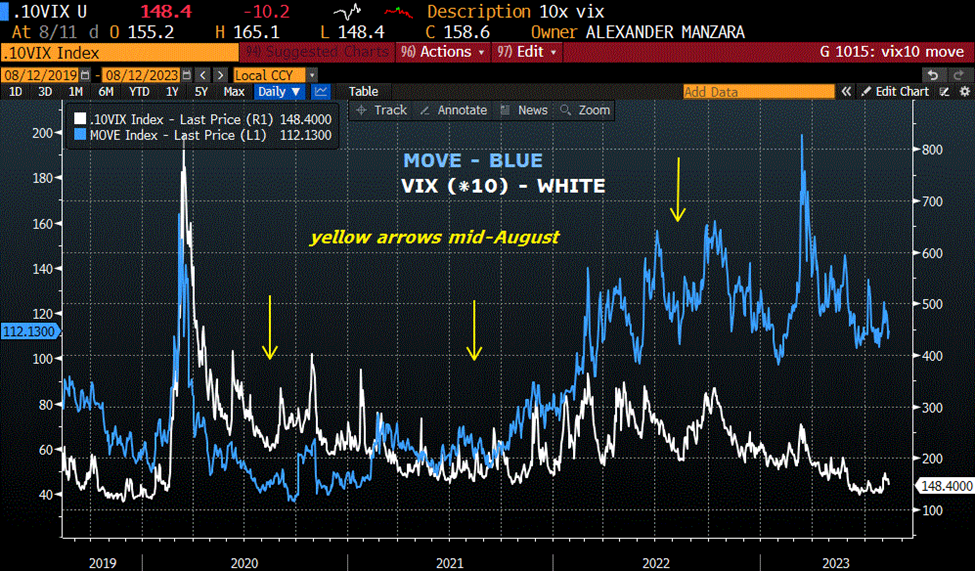
Feels like a shakeout might be coming. Of course, VIX and MOVE aren’t really reflecting it. Nothing happens in August until Jackson Hole right? Vol has a tendency to decline at this time of year. This summer VIX has been at its lowest levels since pre-covid. Last at 14.8. June low 12.9 and July high 15.4. MOVE is also at the low end of the past year’s range at 112. (Jackson Hole Aug 24-26)
Sometimes things do happen in August. From The Guardian, August 11, 2015
China stunned the world’s financial markets on Wednesday by devaluing its currency for a second consecutive day, triggering fears its economy is in worse shape than investors believed.
The move sent fresh shockwaves through global markets, pushing shares sharply lower and sending commodity prices further into reverse as traders feared the move could also ignite a currency war that would destabilise the world economy.
At that time CNY was 6.21 (8/7/15). On 8/12 it reached 6.449 a decline in the value of the yuan of about 3.8%. Now it’s 7.24. The high on Nov 1, 2022 was 7.327 (high since 2007). It’s worth noting that in April of this year, CNY was around 6.87. Since then the yuan has declined by about 5.3% (to 7.24 now). The juggernaut economy of the past decade is seeing its currency crater as debt deflation and property woes smother growth. We’re not hearing much about China ‘exporting deflation’ this time around but certainly the effect is there at the margin.
Walter Bagehot, a British journalist and Editor of the Economist, wrote this in 1856.
“Much has been written about panics and manias, much more than with the most outstretched intellect we are able to follow or conceive, but one thing is certain, that at particular times a great deal of stupid people have a great deal of stupid money… At intervals, from causes which are not to the present purpose, the money of these people – the blind capital, as we call it, of the country – is particularly large and craving; it seeks for someone to devour it, and there is a “plethora”; it finds someone, and there is “speculation”; it is devoured, and there is a “panic.”
Today, we’d call it ‘F-you money’, shown to be plentiful in a world of zero rates coupled with covid-inspired fiscal stimulus. Resulting inflation set the table, but the bulk of that capital hasn’t yet been devoured.
In terms of government’s contribution to continuing inflation, the following snippet from the Senior Citizen’s League shows surprising restraint. Following last week’s CPI:
“The Social Security cost of living adjustment for 2024 is looking increasingly like it may be around 3%…
A COLA of 3% would raise an average monthly benefit of $1789 by $53.70.”
Last year’s adjustment was 8.7%.
SOFR CURVE
The current peak contract/lowest rate on the SOFR curve is Sept’26 at 9637.5 or 3.625%. The lowest/highest yield contract is SFRU’23 at 9459.5 or 5.405%, an inversion of -178 bps. The low of the year for any contract has been Z3 at 9446.5, a rate just above the current high end of the FF target (5.25-5.5%). In early May, in the aftermath of the banking turmoil, the highest settlements for any contract came on 4-May, SFRH5 9739.5, M5 9739.0 and U5 9738.0; rates around 2.6%. Therefore, since then, the highest contract is about 100 bps lower than it was in May. In fact, at 9636.5 (3.365%) the blue SOFR pack (U6, Z6, H7, M7) is at the low settlement of this calendar year.
The largest inversion between the lowest and highest contracts on the SOFR curve has been around 225 bps. Think about that absolute value for a second. Two and a quarter percent. Spreads almost never price the full extent of a hiking or easing cycle. (Low in 2/10 treasury spread was -109). As an illustration, the chart below shows the rolling spread between the 3rd quarterly SOFR contract, now SFRZ3 and the 9th, now SFRM5. This 18 month spread is now -160 (9461.5/9621.5). The low was -210.5 in January.
From the chart you can see that the high in this spread, in anticipation of the hiking cycle to come, traded a high of just over 125 bps. No where near the actual magnitude of the hikes (500 bps in about 18 months). When actual Fed action did start, this spread quickly inverted, pricing a not-so-soft landing. By January of this year blues were trading above 9700, or just below 3%.
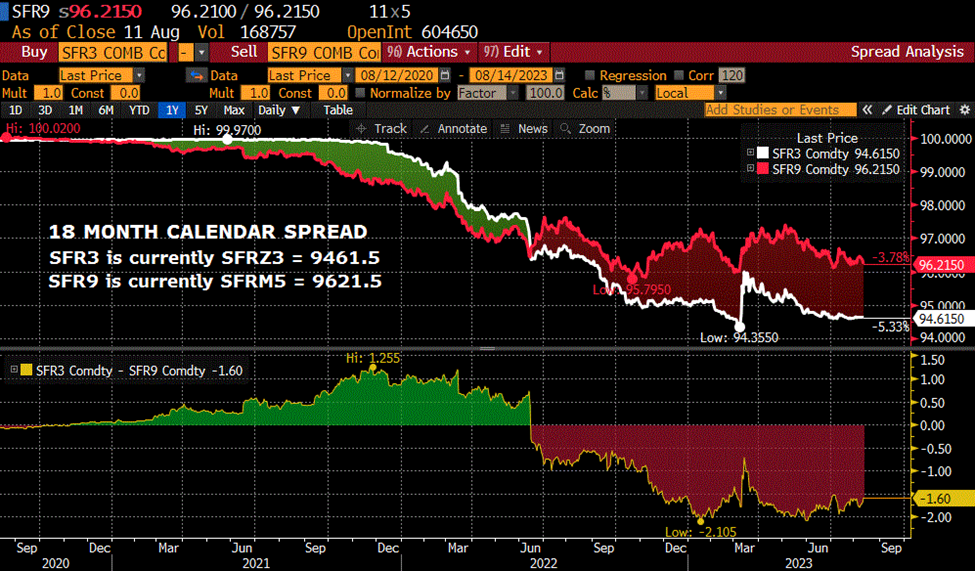
In my opinion, the implication is that when actual easing begins, this spread could easily go positive again.
News this week includes Retail Sales on Tuesday, FOMC minutes on Wednesday, Philly Fed Thursday.
| 8/4/2023 | 8/11/2023 | chg | ||
| UST 2Y | 478.9 | 489.3 | 10.4 | |
| UST 5Y | 416.3 | 430.7 | 14.4 | |
| UST 10Y | 404.8 | 416.4 | 11.6 | |
| UST 30Y | 420.3 | 426.9 | 6.6 | |
| GERM 2Y | 301.4 | 303.8 | 2.4 | |
| GERM 10Y | 256.1 | 262.3 | 6.2 | |
| JPN 30Y | 160.9 | 154.3 | -6.6 | |
| CHINA 10Y | 265.7 | 265.0 | -0.7 | |
| SOFR U3/U4 | -108.0 | -95.0 | 13.0 | |
| SOFR U4/U5 | -77.5 | -73.5 | 4.0 | |
| SOFR U5/U6 | -8.5 | -9.5 | -1.0 | |
| EUR | 110.10 | 109.48 | -0.62 | |
| CRUDE (CLV3) | 82.27 | 82.57 | 0.30 | |
| SPX | 4478.03 | 4464.05 | -13.98 | -0.3% |
| VIX | 17.10 | 14.84 | -2.26 | |

