Medium of transaction
May 16, 2021 – Weekly comment
(This note is long due to charts)
Last week a Bloomberg ‘five things’ post referenced a Diane Swonk (Grant Thornton Chief Econ) tweet which succinctly summarized the reasons sustained inflation shouldn’t be high on the worry list, even with a high expected CPI print. She said, “Some will use the term ‘stagflation’ which was coined in 1973-75 recession to describe inflation and unemployment. That will be wrong.”
In outlining the current boost to inflation, she mentions base effects related to oil’s dip into negative prices, supply bottlenecks, covid safety protocols, the computer chip shortage, Suez canal blockage, pent-up demand associated with stimulus checks. She then describes some features in the 1970’s that are quite different from now: COLAs (cost of living worker contracts), OPEC, policy errors by the Nixon administration, and concludes it is not likely that inflation will be sustained.
https://twitter.com/DianeSwonk/status/1391002997824569345
Here are a couple of things she doesn’t mention: The Fed changed their policy framework in August of last year in order to generate inflation above 2%. The new administration is unabashedly pro-labor and is supporting union activities. Global deflation pressures from China trade have abated. Finally and most importantly, a big part of the “inflation is transitory” argument implicitly rests on the value of the US dollar as a solid store of wealth, used as the primary means of transaction and measurement.
In July of last year (7/29/2020), I created this long-term chart for a post, showing that Corn priced in gold hit a new historic low.
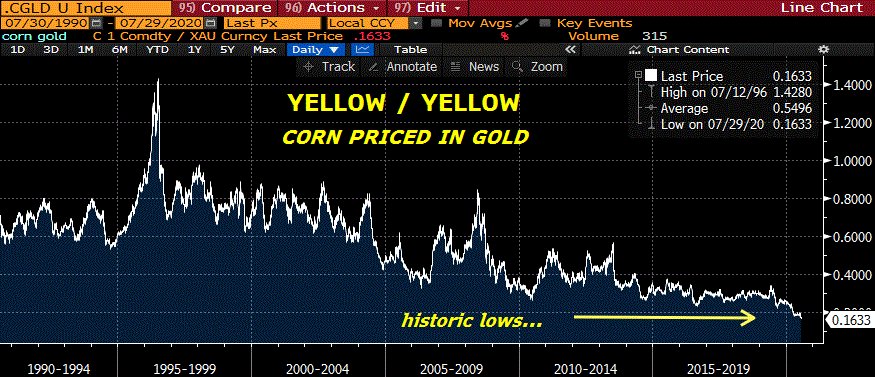
Note that this was just a few weeks before the Fed announced its new framework. What happened next? Take a look at the following chart. It shows that the change in framework almost exactly marked the bottom. Coincidence? Maybe. The long term Corn chart immediately below is priced in dollars.
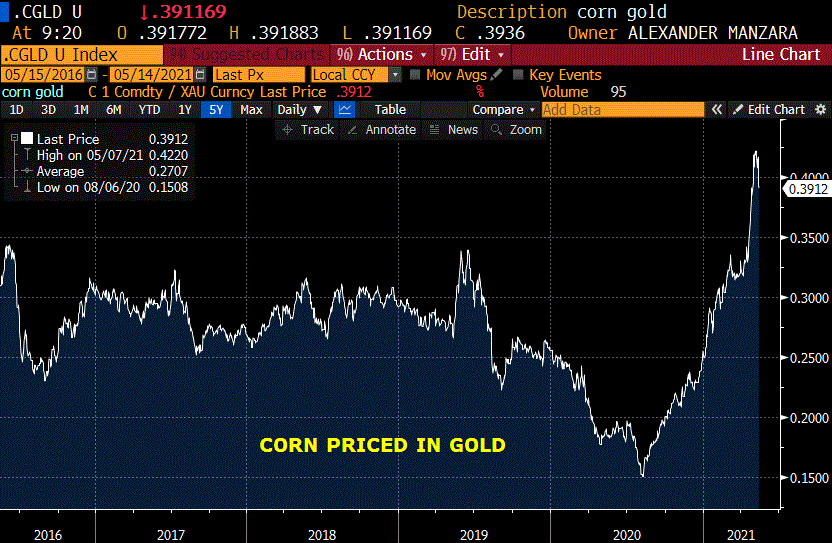
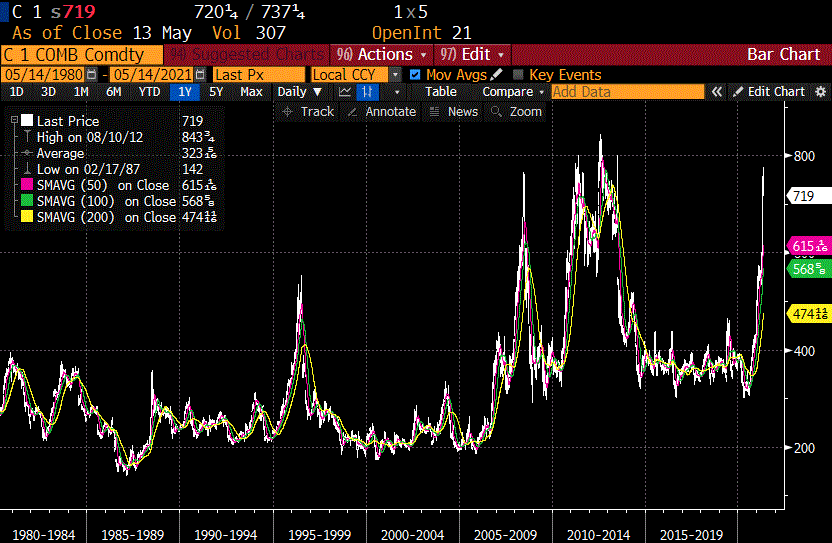
What are the inflation implications? Let me add one more chart, Corn price in bitcoin:
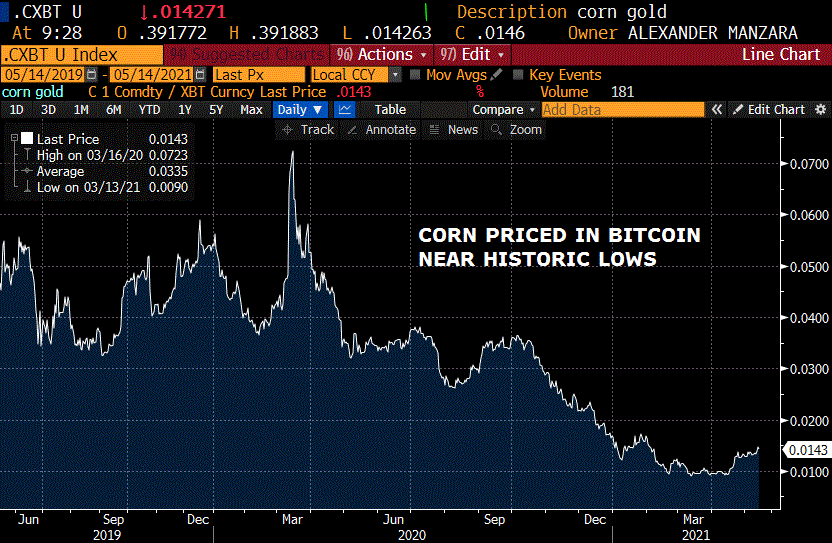
Corn, when priced in bitcoin is still close to the lows. Now, I realize that I have included here charts of various duration in terms of timeframe. All timeframes available to those who request. One might say, “So what? The relative price of corn has changed relative to other things.” My point is simply that prices, and changes in prices, i.e. inflation or deflation, are heavily influenced by the unit of transaction they are measured in. Not exactly an earth-shattering revelation, however, I would say that the concept of money is undergoing an extraordinary transformation in terms of confidence, reflected by the rise of bitcoin, digital yuan, etc. Here in the US we define inflation in terms of dollars, of which 21% of the entire supply was created in 2020, according to Morgan Stanley. Clearly, the price of the dollar has seriously depreciated versus bitcoin and ethereum. (And corn and copper etc). I was sort of jolted when I read that digital yuan might have an expiration date, that it could have a dynamically changing “spend-by” date. Why would I trust that currency? I also read that Switzerland was retiring its series 8 paper currency as of 30-April 2021. “The banknotes from the eighth series thereby lose their status as legal tender and can no longer be used for payment purposes. However, they retain their value and may be exchanged [at the SNB] at any time for an unlimited period.” Countries want to maintain control over the transaction medium used in their countries. It’s understandable, but it makes the whole Capital One “What’s in your wallet?” ad campaign sort of an anachronistic curiosity. You mean my digital wallet? My phone? The US is overtly depreciating USD.
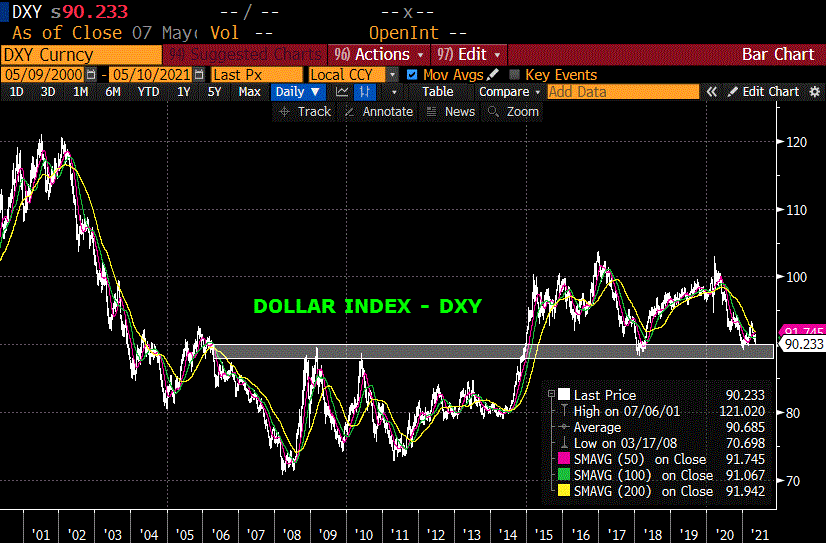
Last week I included a chart of DXY, the dollar index. I haven’t even bothered to update it below, because the net change on the week was small, from 90.23 to 90.52 The grey area shows that its price is in a pivotal area, and appears vulnerable to a further break. But we’ve already seen that it has moved lower relative to other things, i.e. the price of commodities, services, crypto, stocks, etc. Now tell me again why inflation can’t be sustained, and why we should trust the Fed?
Yes, inflation has something to do with policy mistakes. Yes, supply chains are repaired over time (even though we are encountering one snag after another). Yes, rising wages appear to be a necessary pre-condition to sustained inflation. But does that necessarily mean rising wages to the marginal employee? Does not income from rising equity prices and from government transfer programs count?
Here’s one last chart that is frequently trotted out as support for the deflationista mindset. It’s the plunge in the velocity of money.
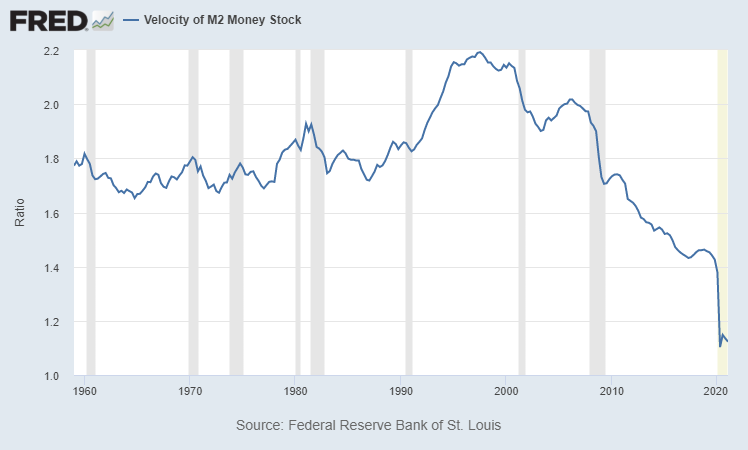
Wow, that’s a pretty stark depiction of economic sluggishness right? But why is it declining so rapidly? Because of the amount of money that has been created. If velocity is GDP/M2, then when M2 soars velocity declines. But think of it this way for a second: as dry leaves falling onto the forest floor. In a drought. Tinder for the next lightning strike. If this measure gets back up to 1.7% for whatever reason, it’s an economic inferno.
Now add a change in attitude from just-in-time to just-in-case. Hoarding. Building of inventories. Delays in receiving product. Increased costs for cyber security. Oh, and an increase in inflationary expectations, on display with U of M’s just released measure of 1 year at 4.6% and 5-10 year at 3.1%. How can you feel good about owning ten year treasuries at 1.65% when the Fed is guaranteeing they will depreciate the purchasing power of your already questionable currency by at least 2% per year? One other note from the Treasury monthly budget, citing CreditBubbleBulletin: “YTD expenditures were up 22.5% while receipts rose 16.1%. Forty-six cents of every dollar spent so far in the fiscal year have been borrowed. Washington is on pace for back-to-back $3 TN plus annual deficits.”
OTHER MARKET THOUGHTS/ TRADES
There was a buyer Friday of 100k 2EN 9900 puts for 5.5 to 6.0 on Friday. Settled 6.0 ref 9916.0s in underlying EDU’23. Expiration is 16-July, so the June FOMC is covered, as is the July 1, 100th anniversary of the China Communist Party, but the Jackson Hole Conference, which is in late August is not. 2EN 9925 puts settled 15.5, which gives a rough approximation of where the 9900’s might go on a 25 bp sell off. We’re at the 8th anniversary of the May 2013 taper tantrum. From early May 2013 to late June, the 9th Eurodollar contract (currently EDM3, but it will be EDU3 in a month when contracts roll) traded from 9945 to 9847. Again, the tantrum may not be a proper blueprint for today’s environment. But imagine if the employment data next month (4-June) is the blockbuster that was anticipated for the last report. Imagine that the June 10 CPI release is just a little worse than May’s. Consider the possibility that Kaplan’s suggestion of shaving the Fed’s MBS buying in a red hot housing market gains currency as the first step of taper, and that the Fed makes steps in that direction at the June 16 FOMC. Could the 9900 strike go in the money? One other quick thought, the Fed does not hedge its MBS portfolio. If the Fed does cut MBS buying, might vol also tend to move up as demand for hedges from the private market expands?
| 5/7/2021 | 5/14/2021 | chg | ||
| UST 2Y | 14.3 | 14.9 | 0.6 | |
| UST 5Y | 76.9 | 81.9 | 5.0 | |
| UST 10Y | 158.5 | 163.7 | 5.2 | |
| UST 30Y | 226.8 | 235.4 | 8.6 | |
| GERM 2Y | -68.5 | -65.6 | 2.9 | |
| GERM 10Y | -21.5 | -12.9 | 8.6 | |
| JPN 30Y | 65.2 | 65.2 | 0.0 | |
| CHINA 10Y | 315.2 | 313.6 | -1.6 | |
| EURO$ M1/M2 | 6.0 | 8.0 | 2.0 | |
| EURO$ M2/M3 | 32.5 | 37.5 | 5.0 | |
| EURO$ M3/M4 | 68.5 | 68.5 | 0.0 | |
| EUR | 121.63 | 121.47 | -0.16 | |
| CRUDE (active) | 64.88 | 65.36 | 0.48 | |
| SPX | 4232.60 | 4173.85 | -58.75 | -1.4% |
| VIX | 16.69 | 18.81 | 2.12 | |

