Libor rate to decline in order to converge to futures
March 29, 2020 – Weekly comment
On Sunday, 15 March, the Fed cut the FF target to 0-25 bps. On the 16th, the Fed Effective rate fell to 25 bps from 110 on Friday the 13th. Since then it has fallen further, to just 10 bps last Wednesday and Thursday. On 12 March, 3-month libor set at a low of 74 bps; this is prior to the ease. It has risen each and every day since then, reaching 145 bps on Friday, a surge of 71 bps. On 12 March, EDJ0 settled at 99.43 and EDM0 99.535. On Friday, EDJ0 was down to 98.78, a drop of 65 bps and EDM0 settled 99.38, a fall of 15.5 bps. It’s worth noting that SOFR was 120 bps on 12-March and it is now 1 bp.
This is the crux of the Fed’s problem. While libor is likely to be replaced as a benchmark, there are still trillions of instruments based on libor. In previous episodes of QE, the Fed encouraged participants to move out the risk curve, which, in a low rate environment, sparked the use of leverage to juice returns. It was pretty clear in Q4 2018 that the reversal of Fed policies caused a significant asset re-evaluation, which the Fed answered by cutting rates and injecting liquidity. Just like always.
However, like the repo flare-up of last September, the plumbing is now clogged, but this time it’s going to take a lot more than the plunger. Because now, credit concerns embedded in libor are laid bare. There are a couple of takeaways from the top paragraph prices. First, EDJ0/EDM0 calendar spread is an astonishingly wide -60 bps. Additionally, there are still 23 bps of convergence between the libor setting and EDJ0 and that’s with only 9 sessions to go. The market is tacitly saying (or hoping), that the Fed will, one way or another, get the libor setting DOWN. Obviously, if that were not the case, the simple trade is to buy puts on EDM0 and sit back to watch the contract sink to 98.55. For example, EDM0 9900p settled 5.5.
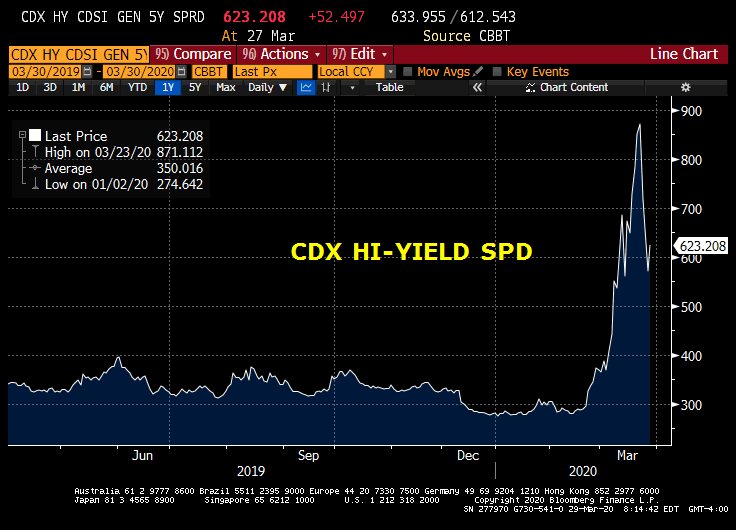
Some market prices have already begun to turn after extraordinary spikes, for example, IG and HY CDX (pictured below). TY vol peaked in early March above 13 and is now less than half that level at 6.0. Stocks had a bounce this week with SPX up 10%. However, fragility is close to the surface, as evidenced by the late sell-off Friday in ESM0 (dropping over 80 points or 3.3% in about 20 minutes) when the Fed announced it was shaving treasury buying from $75 billion a day to just $60 billion a day starting April 1. In my opinion, there are two keys for financial assets. First, the Fed has to get libor down, and second, the Fed and Treasury have to further weaken the dollar.

The pricing on forward eurodollar contracts indicates a high confidence level that the Fed will eventually get the libor situation controlled. One of the catalysts which contributed to the stock market sell off was the oil war sparked by the Russia/Saudi disagreement over production cuts. Even there, the market perceives improvement over time, with CLK0 settling 21.51, but CLZ0 more than 55% higher at 33.45. However, oil in the 30’s still projects much weaker end-user demand. The future is likely to be a very slow grind back to economic growth, augmented by monetary policy that might spark price inflation rather than financial engineering this time around. Downgrades and bankruptcies will hopefully be drawn out over time. The Fed isn’t likely to be able to strengthen growth with zero rates. What it can do is arrest the plunge in financial assets, which will hopefully restore some measure of confidence.
ISM numbers this week, along with the Employment report on Friday. There’s an estimate of 45 for ISM Mfg. Low in 2008 was 34.5. I think the 3.28 million jobless claims number tells us all we need to know about the employment picture.
OTHER MARKET/TRADE THOUGHTS
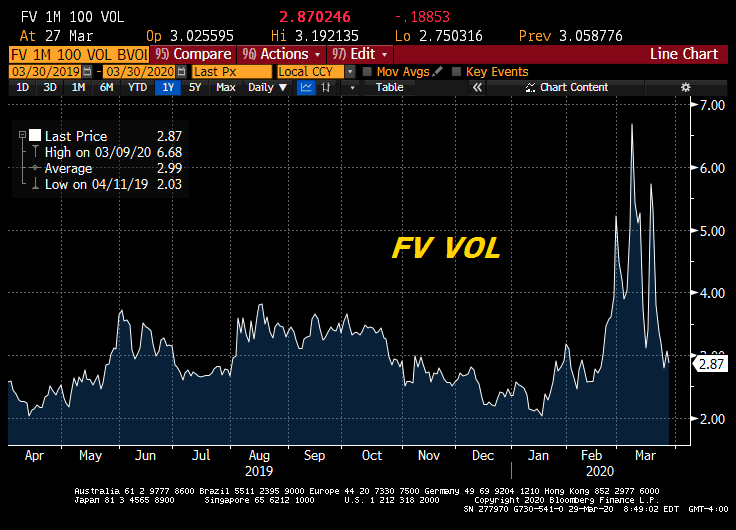
Treasury vol has come down fairly dramatically. Here’s a picture of FV vol. Good sign for a return toward ‘normalcy’.

| 3/20/2020 | 3/27/2020 | chg | ||
| UST 2Y | 33.3 | 25.5 | -7.8 | |
| UST 5Y | 54.3 | 42.0 | -12.3 | |
| UST 10Y | 93.4 | 73.6 | -19.8 | |
| UST 30Y | 157.2 | 132.5 | -24.7 | |
| GERM 2Y | -67.7 | -68.4 | -0.7 | |
| GERM 10Y | -32.1 | -47.4 | -15.3 | |
| JPN 30Y | 42.9 | 41.5 | -1.4 | |
| EURO$ M0/M1 | -15.5 | -31.0 | -15.5 | |
| EURO$ M1/M2 | 9.0 | 9.0 | 0.0 | |
| EUR | 106.97 | 111.69 | 4.72 | |
| CRUDE (1st cont) | 22.63 | 21.51 | -1.12 | |
| SPX | 2304.92 | 2541.47 | 236.55 | 10.3% |
| VIX | 66.04 | 65.54 | -0.50 | |

