Let them eat chocolate
Feb 11, 2024 – Weekly Comment
***********************************
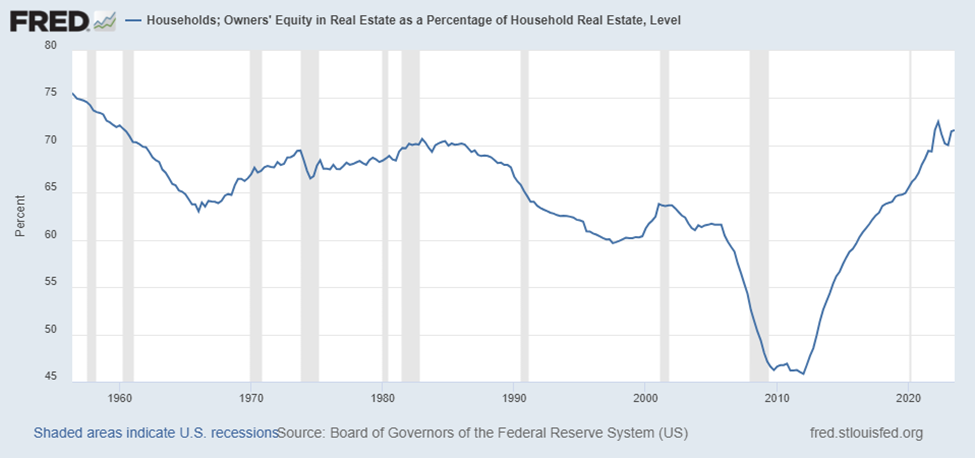
The image below is from the St Louis Fed; Households Owners’ Equity in Real Estate as a Percentage of Household Real Estate, Level. It’s nearly 72%. And surpasses every level since 1960! After the GFC, Homeowner’s Equity fell to around 46%.
The next image is the homeownership rate (starting a bit later, in 1965).
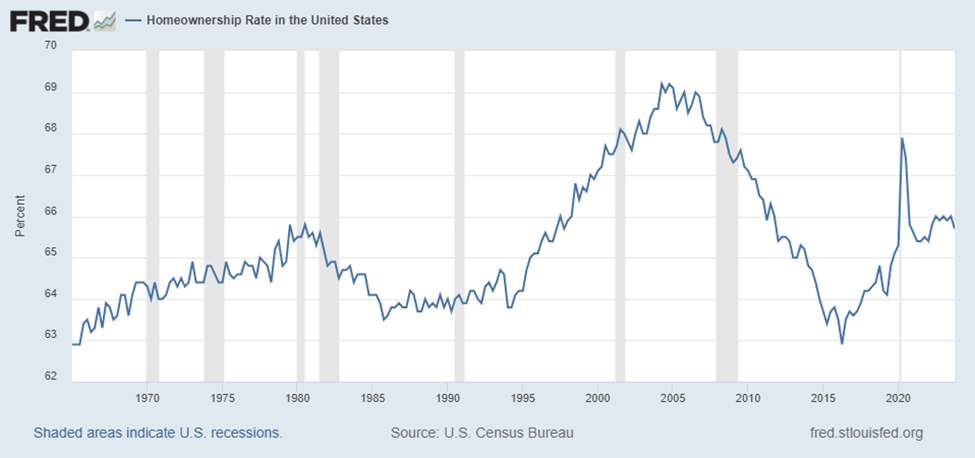
The homeownership increase from the mid-1990’s peaked right in the middle of 2004, when the Fed began its hiking campaign from 1% to 5.25%. The huge rate cuts in 2001 gave way to the adjustable-rate mortgage spree going into the GFC. The FF target was 1.25% to 1% from late 2002 to mid-2004, and shorter-term adjustable rate mortgages were in vogue.
Currently, there’s hand-wringing about Consumer Credit being at a record high $1.3t, and HH mortgage outstanding also at a record high $12.950t. However, 15 years ago in 2009, HH Mortgage was $10.441t and HH Owner-Occupied Real Estate was valued at $19.417t. Since then, the amount of mortgage outstanding went up 24% but the value of HH RE more than doubled to $45.5t. Nothing to see here.
In 2008 Revolving Consumer Credit peaked at a little over $1t. At the time nominal GDP was $14.97t and now it’s nearly doubled to $27.9t. Again, an increase of 30% in debt vs a double in income. In aggregate the household sector seems rather conservative since the GFC, though perhaps less so in very recent history.
Where HH debt has exploded at a growth rate well exceeding the growth of the economy is Non-Revolving Credit, from $1.64t in 2008 to $3.7t now. The culprit is student loans which went from $135 billion at the end of 2008 to $1.467t now. If student debt is removed from the equation, then both revolving and non-revolving credit have grown more slowly than the economy.
Households that own unmortgaged property and have savings are doing just fine. They had bank deposits that were earning nothing, then the Silicon Valley Bank Crisis focused everyone on the risks of bank bail-ins, while at the same time t-bill and money markets were paying 5% or more. Income from bills and bonds now actually provides a cushion for equity investing. This part of the population is quite different from the portion suffering rising credit card and auto loan delinquencies and complaining about the spiraling costs at fast food restaurants. In last week’s congressional testimony, Yellen said, “We don’t have to bring prices down, because wages are going up.” She might as well have said, “Let them eat chocolate!” (The price of cocoa has doubled in the past year and is up 35% just since the start of 2024).
Back to the charts above. The percentage changes aren’t huge; does it really matter if homeownership goes down from 68% to 66%? Maybe not. However, my interpretation of the data highlights growing wealth disparity. Not exactly a novel topic. However, everything happens at the margin. Fraying begins at the edges.
My personal opinion is that government has accentuated a lot of problems. Whether that’s right or wrong, there is no question about the growth in government. In 2009, Federal Debt outstanding was $8.88t. As of Q3 2023 it’s $28.75t, 3.25 times higher. Compare that with the relatively muted increases in consumer borrowing (ignoring federally funded student loans).
I knew a corporate bond salesman from 20 years ago, who amusingly handed out business cards which listed his title as ‘Treasury Bond Credit Analyst’. Funny. There is no credit aspect of treasuries to analyze. Right? But anyone who looks at the growth of Federal Debt vs Income sees the deterioration.
I saw this item in worthinsurance.com. “Among homeowners, an average of 16.4% of their income goes to housing costs. This includes mortgage, property taxes and homeowner’s insurance. Meanwhile, 45% of renters spend over 30% of their household income on housing costs.”
The big asset managers have loaded up on residential real estate to take advantage of rising rents. Given the current AirBnB bust, perhaps the rental strategy has some holes in it. Is there another government bailout around the corner?
OTHER THOUGHTS
The ten year yield rose 16.7 bps this week to 4.185%. On the SOFR curve, the biggest declines were Sept’25, Dec’25, March’26, June’26, all down 19 bps (9642, 9647.5, 9647.5, 9645.5). The middle two of those contracts are the peak, or lowest rates, on the SOFR strip, at about 3.5%. It’s not surprising to see yields moving higher in this part of the curve, given relatively strong economic data, large treasury auctions, and Fed officials pushing back against the magnitude of rate cuts that had been priced in STIR futures. However, the curve really didn’t flatten much. Gold SOFR contracts, the fifth year forward, were down 15.75 bps on the week. Consider this longer term chart of the 2/10 treasury spread:
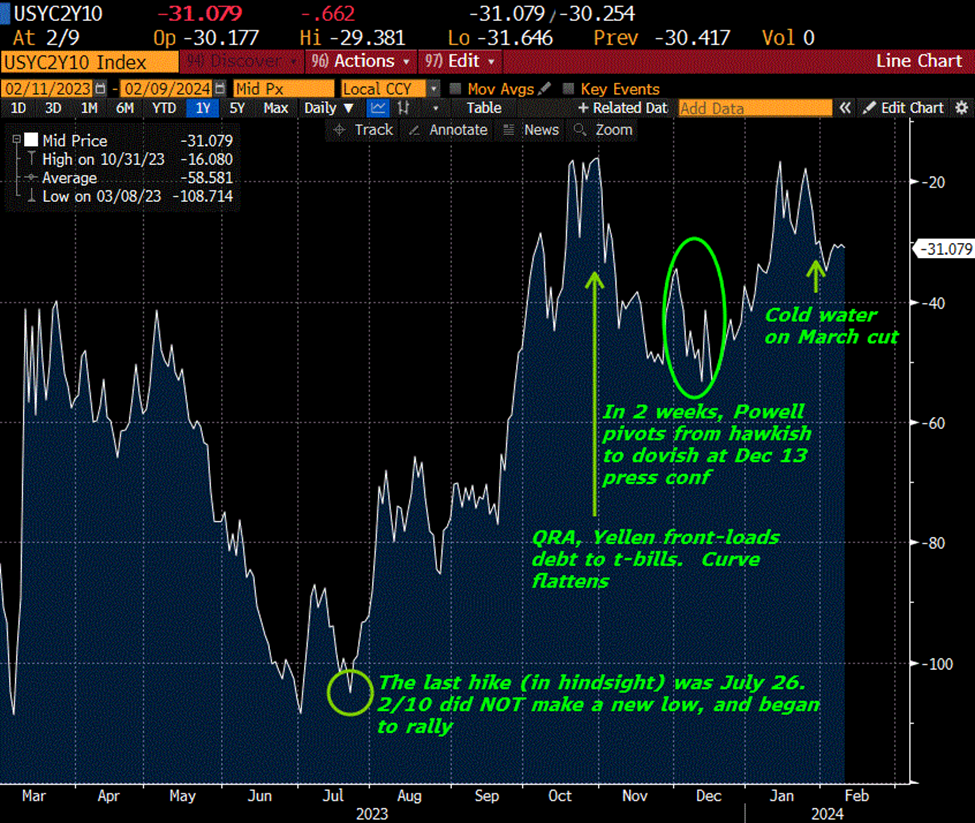
There’s a double bottom from March and July 2023, at about -108. Recently the chart has a double top around -16. The curve has flattened since the last FOMC, but the move has been muted. Closes above negative 16 would suggest Fed rate cuts of more than 75 bps by year end. I favor a steepening curve, easily expressed using SOFR contracts and or options. I will post specific rec by e-mail on Monday.
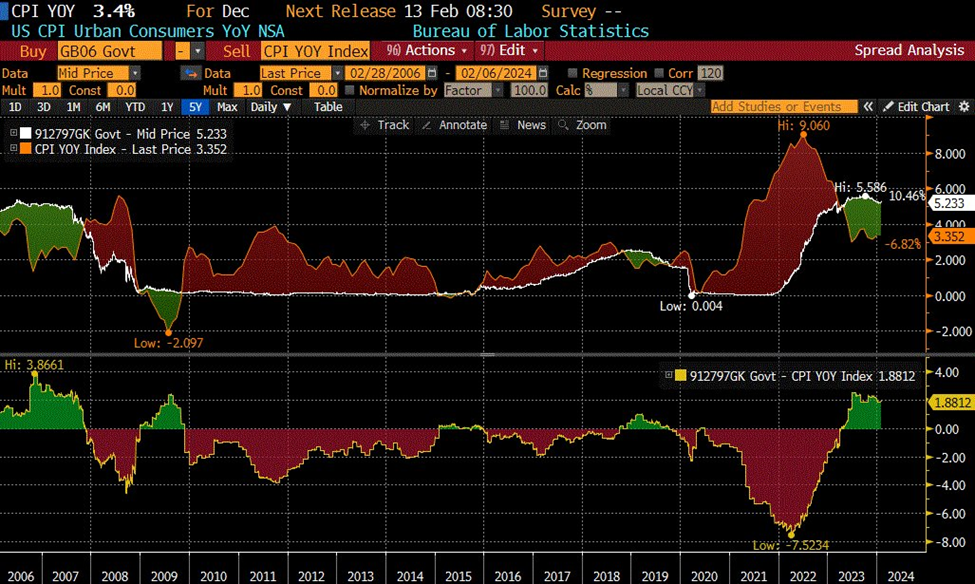
CPI is out on Tuesday, expected 2.9% yoy vs 3.4% last. If expectations are correct, it would be the first sub-3% print since Q1 2021. Core CPI yoy expected 3.7% from 3.9% last. Retail Sales on Thursday. The chart below shows CPI vs the 6-month t-bill yield. The cross to a positive ‘real yield’ only occurred about eight months ago. This spread has only been above 200 bps (currently 190) a few times since 2000: In 2000, corresponding to the dotcom bubble burst, in 2006/07, about a year before the housing bubble burst, very briefly in 2009 and now. 2001 and 2008 landings weren’t all that smooth.
| 2/2/2024 | 2/9/2024 | chg | ||
| UST 2Y | 437.0 | 448.6 | 11.6 | |
| UST 5Y | 399.7 | 414.9 | 15.2 | |
| UST 10Y | 401.8 | 418.5 | 16.7 | |
| UST 30Y | 422.7 | 438.0 | 15.3 | |
| GERM 2Y | 256.9 | 271.6 | 14.7 | |
| GERM 10Y | 224.1 | 238.2 | 14.1 | |
| JPN 20Y | 145.0 | 150.9 | 5.9 | |
| CHINA 10Y | 242.9 | 243.9 | 1.0 | |
| SOFR H4/H5 | -146.0 | -132.0 | 14.0 | |
| SOFR H5/H6 | -40.5 | -38.0 | 2.5 | |
| SOFR H6/H7 | 7.5 | 6.5 | -1.0 | |
| EUR | 108.09 | 107.84 | -0.25 | |
| CRUDE (CLH4) | 72.28 | 76.84 | 4.56 | |
| SPX | 4958.61 | 5026.61 | 68.00 | 1.4% |
| VIX | 13.85 | 12.93 | -0.92 | |
https://www.federalreserve.gov/releases/z1/20231207/html/b101.htm

