Supply Tantrum? Weekly, April 29, 2018
US Ten year yield tops 2% as Bernanke says Fed may taper buys
–Bloomberg headline on May 22, 2013, following Bernanke’s Congressional testimony. The start of ‘The Taper Tantrum’
”The program relates the flow of asset purchases to the economic outlook. As the economic outlook – and particularly the outlook for the labor market – improves in a real and sustainable way, the committee will gradually reduce the flow of purchases.”
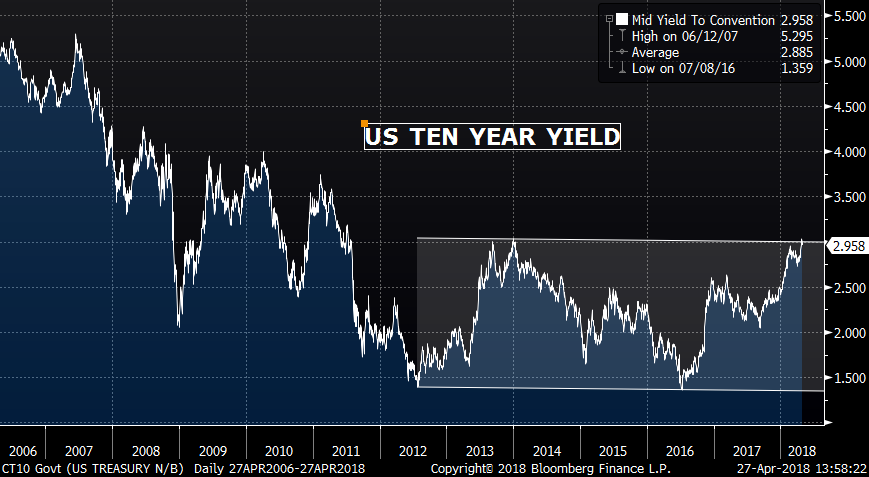
Just about 5 years ago, Bernanke sparked the taper tantrum on May 22, and added further fuel in the FOMC press conference of June 19. By the end of 2013 and into the beginning of 2014, the ten year yield had soared to just over 3%, a level that was finally revisited this week. As the chart below indicates, the yield level in the beginning of 2013 was quite low, 1.60% – 2.0%.
This week, the long round-trip to 3% was completed. Looking at the chart, one might be tempted to say we’re at the top of the range, time to sell. Indeed Citi did just that, recommending entry at 3% with a target of 2.65%.
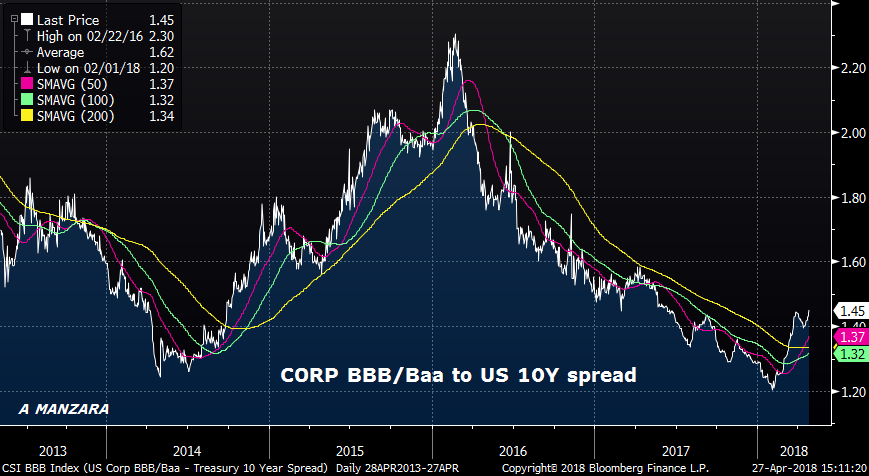
There are a lot of longer term indicators which suggest that yields SHOULD come back down. For example, yoy M2 growth has been falling consistently, suggesting a slowdown. Annualized growth has gone from a rate of 7.25% in September 2016 to just below 4% currently. (Chart at bottom). Commercial and Industrial loans tell a similar story. C&I loan growth peaked in Dec 2014 at 12.6%, versus the most recent mark of 2.6%. The low in November last year was a pace of only 0.5%. The tax bill with immediate capital depreciation and other stimulus is likely causing loan growth to bounce; the broader point is that some factors suggest economic deceleration. Additionally, while the early part of the hiking cycle was ironically associated with looser financial conditions, tightening is now becoming apparent across markets. Dudley relates financial conditions to short and long term rates, the value of the dollar, stocks, and corporate spreads. Both short and long rates have made new highs, while the curve has flattened. The dollar rallied this week and appears to have bottomed. Stocks have dipped. While junk bond spreads remain tight, flows into HYG and JNK etfs have slowed. Below is a chart showing BBB spread to treasuries and it has turned higher since the start of the year. (Corporate spreads may stay relatively tight just because of the vast amount of gov’t supply). Tighter conditions will take a bite out of forward growth.
However, there are many shorter term issues that will likely dominate the direction of yields in the near term, and many of those are bearish. For example, on Monday, PCE prices, which is the Fed’s preferred inflation measure, is released. Both headline and core are expected 2.0%, finally at the Fed’s target. Powell and many others have talked about calendar effects which will support inflation data going forward. Here’s a snippet from last year regarding mobile phone service prices: “Paul Ashworth, chief U.S. economist at researcher Capital Economics, recently explained ‘that nearly half of the decline in core CPI inflation this year can be traced to a single item: wireless telephone services’.” From the same article, “Per Labor Department statistics, mobile plan prices dropped nearly 9% between March and April, and since April 2016, service prices are down nearly 13 %.” These price drops are now falling out of inflation comparisons. Last month Core PCE Prices were 1.6%. On Monday, the expectation is 2.0%. If it hits, it will be the highest since 2012. Will the market shrug it off? Perhaps, but consider other factors…
First, WTI Crude closed around $68, near the high of the year. Last year in April it was around $50/bbl. On May 12, Trump will decide whether to continue suspension of sanctions on Iran. Renewed sanctions will likely be associated with a drop in global oil supply and even higher prices. Inflationary.
Second, everyone knows that employment data is generally strong. This was underscored by last week’s historic low in jobless claims of only 209k. ECI was +0.8 last week, more than expected. From Bloomberg: “Employment cost index rose 0.8% q/q (est. 0.7%); after 0.6% gain. Wages and salaries advanced 0.9% q/q; benefits costs climbed 0.7%. Total compensation, which includes wages and benefits, climbed 2.7% over past 12 months, strongest since 3Q 2008, after 2.6% gain. Private-sector wages and salaries advanced 2.9% y/y, also the largest since 3Q 2008, after rising 2.8%.” This Friday the Employment report is released, with NFP expected 190k and Avg Hourly Earnings +2.7% yoy.
Third, the treasury releases the quarterly refunding schedule this week. Supply is expected to be huge, and, as I mentioned last week, the amount of new cash simply associated with the 3, 10 and 30 year auctions next week starting May 8 is expected to be $33 billion out of the $72b to be auctioned. That money has to come from somewhere. How about a yield concession? This is probably childishly simplistic, but the Chinese may say, ‘why should we recycle our trade surplus into US treasuries so that the US can deficit-spend to build up its military? Why don’t we focus on building OUR military capabilities for control of the South Sea, etc.’
The point is that there are a lot of potentially bearish news items for bonds in the next two weeks. It wouldn’t surprise me to eventually get back to 2.65%, but I would say it’s more probable that 3.25-3.33% is reached first. The original taper tantrum caused a yield surge in tens from 1.60 to 3.00, a total of 140 bps. This year’s Supply Tantrum(p), could be marked by a yield move of similar magnitude. Last September’s low was just over 2%, so an increase of 140 bps would target 3.40/3.45. The 50% retracement from the high yield in 2007 of 5.30% to the low in 2016 of 1.36% is 3.33%.
Obviously a big break in stocks could shift the tide of funds into bonds. While Amazon reported blow-out revenue of $51 billion (+43% yoy), Nasdaq was nearly unchanged Friday. Big tech isn’t causing growth, it’s cannibalizing other companies. Additionally there has been notable weakness in financials, with many big banks just barely rebounding from late March lows (example, IYF, i-shares US Financials).
The treasury refunding announcement is on Wednesday morning at 8:30; the FOMC announcement is Wednesday afternoon. If the PCE price data are strong, then there could be a slight upgrade in language regarding inflation, otherwise there is little reason to expect a change.
OTHER MARKET THOUGHTS/ TRADES
Week to week changes across markets were rather small. On the week, 10’s rose just 1 bp to 2.957. SPX barely changed. Same with crude oil. It’s no wonder that vol slipped. I include a TY vol chart which shows we are close to multi-year lows, a rather surprising reversal from the VIX blow-up earlier this year. I actually marked USU vol sub 7%. The USU put seller added to his position, and although underwater on the initial 143 put sales, the 139 puts sold last week at 1’23 to 1’20 settled at 0’61. Several analysts (DB, BAML) suggest that odds of a debt inspired crisis are increasing for the US. Of course, this would be a longer term, low probability event, but still suggests that implieds are too low in treasuries.

| 4/20/2018 | 4/27/2018 | chg | |
| UST 2Y | 247.5 | 248.0 | 0.5 |
| UST 5Y | 279.5 | 279.9 | 0.4 |
| UST 10Y | 294.7 | 295.7 | 1.0 |
| UST 30Y | 313.8 | 312.5 | -1.3 |
| GERM 2Y | -56.1 | -57.8 | -1.7 |
| GERM 10Y | 59.1 | 57.1 | -2.0 |
| JPN 30Y | 73.1 | 73.0 | -0.1 |
| EURO$ Z8/Z9 | 34.0 | 33.5 | -0.5 |
| EURO$ Z9/Z0 | 7.0 | 8.5 | 1.5 |
| EUR | 122.89 | 121.31 | -1.58 |
| CRUDE (1st cont) | 68.40 | 68.10 | -0.30 |
| SPX | 2670.14 | 2669.91 | -0.23 |
| VIX | 16.88 | 15.41 | -1.47 |

http://www.realclearlife.com/finance/mobile-phone-plans-unlimited-data-limited-inflation/
https://www.treasury.gov/resource-center/data-chart-center/quarterly-refunding/Pages/Latest.aspx

