Inflation and Interest Rates. Unrelated
July 18, 2021 – weekly comment
Here’s a nice summary of recent inflation data by CreditBubbleBulletin:
Consumer Prices (CPI) jumped 0.9% in June, versus expectations of a 0.5% increase. Year-over-year CPI was up 5.4% (expectations 4.9%), the strongest jump since 2008. And for analysts with issues with year-over-year “base-effects”, consumer inflation was up 3.3% in only five months. Core CPI also gained 0.9% for the month, with a 4.5% y-o-y increase. Producer Prices rose a data series record 7.3% y-o-y. Import Prices jumped 1% for the month and 11.2% y-o-y. University of Michigan one-year Inflation Expectations rose to 4.8%, the high since the summer of 2008. Also, at 4.8%, the New York Fed’s survey of one-year inflation expectations jumped to the highest level in data back to 2013.
Against this data we have the market’s reaction in rates: US tens down nearly 6 bps on the week to 1.30%. Bunds down 6 on the week to -35.3. EDZ’23/EDZ’24 one-year calendar down 6.5 bps on the week to 33.5. EDZ’22/EDZ’24 two-year calendar fell 5 bps to 89.5, the lowest settle since early February. The high was 137, set on the last day of Q1. This Z2/Z4 spread is interesting in that it has seen relatively heavy volume. Immediately after the FOMC in June it traded 118. Two weeks later on June 28, there was large new buying at 106.5 to 107. I had seen this bit of commentary at that time recommending the trade:
The EDZ2Z4 steepeners offer some asymmetry, in that there is limited scope to price in more hikes in 2022 given the compressed timelines. If economic data comes in strong, the Z2Z4 curve will steepen, led by EDZ4, as the market prices in faster pace of hikes in 2023 and 2024. On the other hand, if economic data is weak, EDZ2 can rally strongly, as the first order for the market will be to price out the aggressive path from tapering through to the first rate hike. EDZ2Z4 also offers an attractive entry level, as well as ~7bp rolldown over three months.
Steepeners have not worked. The highs in nearly all curve trades were on the last day of March. Since then it has been a grinding flattener, exacerbated on the back end of the curve by the hawkish dot plot of the June FOMC. On June 16, the date of the meeting, EDZ’23/EDZ’24 settled 55.5. It’s down nearly ¼ percent currently at 33.5. Similarly, 5/10 treasury spread was 80 on June 1 and is now 52. In spite of huge inflation prints, EDZ’24 has rallied from its low settle of 9807.5 on April 2, to 9863.0 as of Friday.
Obviously, the easy explanation is that the market has accepted Powell’s idea that inflation is most evident in sectors related to re-opening, and is therefore temporary, and that growth has likely peaked, especially as formidable fiscal spending tails off. Against this argument, one can easily point to factors in favor of more permanent inflation, including huge growth in monetary aggregates (which operate with a lag), investment in green energy which is likely to be more expensive than fossil fuels, redundant supply chains, and an increase in inflation expectations, a topic which Powell has repeatedly stressed in terms of holding down inflation.
There’s a fascinating interview with Russell Napier in which he argues that governments are now in the business of financial repression, a slow transfer of wealth from savers to debtors. I have linked it below; his thesis is almost an exact counter to Lacy Hunt’s assertions that yields will always be forced down, in part because the velocity of money continues to trend lower.
https://themarket.ch/interview/russell-napier-we-are-entering-a-time-of-financial-repression-ld.4628
Here’s a small excerpt:
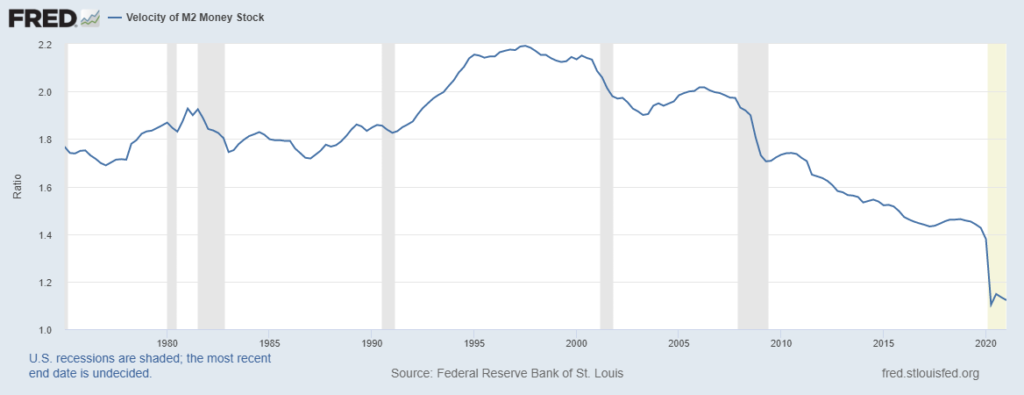
Velocity has been on a structural downward shift since 2009. Why?
If you look at US financial history, velocity was in a rather stable range above 1.6 from 1959 to 2009. The downward shift after 2009 was, in my view, the result of the Fed’s quantitative easing policy. With QE, the Fed bought financial assets in the market, and it basically bought them from savings institutions. The only thing these institutions could do with the newly created liquidity was to buy more savings assets. So the QE policy never reached the real economy, it never created broad money growth, it just pushed up asset prices. But now, with broad money created by the banking system, it will hit the real economy, therefore velocity will normalize.
I think the great surprise over the coming years will be when velocity goes back up towards 1.6. But forecasting velocity is fiendishly difficult. It’s like trying to juggle an incontinent squid: Something you really don’t want to do, and you’re very unlikely to be successful. The change in velocity downward after 2009 fooled everybody. Many people at the time said that QE must create inflation. But because velocity collapsed, there was no inflation. I think it will surprise on the upside this time. So while we can’t forecast velocity, we can put a risk to it, and I think the risk of velocity shooting up is higher than any time since the 1970s.
What will cause velocity to take off?
When people decide their savings can’t be sustained and do something with it. This will happen when the government starts to cap bond yields at a level permanently below inflation.
The interview continues [note that the US 10y TIP is negative 105 bps, closing in on the historic low this year of -111]:
Many people think yields will shoot up once central banks stop buying bonds.
Won’t they?
No, because then the government will force savings institutions to buy bonds. That’s stage two of bond yield control. Mind you, the transition from stage one to stage two won’t be smooth. Legislation will have to be passed to allow governments to in effect allocate private sector savings through greater control over regulated financial institutions. So there could be a period where bond yields rise too quickly and markets will panic. But ultimately governments will cap interest rates by using the savings system. Just like they did after World War II.
While there hasn’t been legislation to force banks to buy long duration assets, the extreme levels of excess reserves coupled with waning loan growth has banks upping their bid for long assets. Powell’s steadfast support of unprecedented accommodation in the face of rising inflation and asset price speculation is a form of repression. As tax revenues rise and government spending slows into the coming year, bond SUPPLY will actually begin to taper. At that point reduced buys by the Fed won’t make a difference.
Below is a chart of M2 Velocity, followed by yoy growth in Commercial and Industrial Loans. Loan growth exploded when COVID hit, as companies drew lines of credit. Now growth has fallen hard, probably due in part to forgiveness of government loans, another factor which creates a bid for long dated assets.

OTHER THOUGHTS
The week ahead will likely be a quiet one. Not much out in the way of news, and the Fed’s blackout period prior to the July 28 FOMC has commenced. On Wednesday, 20 year bonds are auctioned. On July 13, a sloppy 30 yr auction sparked a sell-off in USU from 162-24 to 161-06. However, that episode of questionable demand immediately faded as bonds rallied the rest of the week, with USU closing 163-26. The twenty-year auction could be an important test.
Dramatic flattening from greens to blue and greens to golds in the wake of the June FOMC is of interest as we draw nearer to the July FOMC. There are no economic projections at the July meeting, but there is clearly dissent between the board and several Fed Presidents. The most compelling trade in my opinion is a fade of the flattening. The question is one of timing. A more hawkish tone will likely enforce the trend of flattening which started at the beginning of Q2. However, we could easily see a capitulation trade, “buy the rumor sell the fact” where the curve re-steepens coming out of the meeting. Will add specific trade ideas next week.
In some ways, since the Fed’s risks to the economy and reason for continued accommodation were centered around COVID, they NEED the delta variant now to justify continued balance sheet expansion (even at a slower pace) and zero rate policies. If I know my Greek alphabet, variant epsilon and/or zeta are on the way.
| 7/9/2021 | 7/16/2021 | chg | ||
| UST 2Y | 21.3 | 22.4 | 1.1 | |
| UST 5Y | 78.6 | 77.8 | -0.8 | |
| UST 10Y | 135.8 | 129.9 | -5.9 | |
| UST 30Y | 198.3 | 193.1 | -5.2 | |
| GERM 2Y | -67.6 | -68.4 | -0.8 | |
| GERM 10Y | -29.3 | -35.3 | -6.0 | |
| JPN 30Y | 66.9 | 64.0 | -2.9 | |
| CHINA 10Y | 299.7 | 294.8 | -4.9 | |
| EURO$ U1/U2 | 19.5 | 20.0 | 0.5 | |
| EURO$ U2/U3 | 56.5 | 59.5 | 3.0 | |
| EURO$ U3/U4 | 42.5 | 37.5 | -5.0 | |
| EUR | 118.80 | 118.06 | -0.74 | |
| CRUDE (active) | 73.81 | 71.56 | -2.25 | |
| SPX | 4369.55 | 4327.16 | -42.39 | -1.0% |
| VIX | 16.18 | 18.45 | 2.27 | |

