Imbalances
Weekly Comment – January 9, 2022
Yields surged in the past week, with the ten year ending the week at 1.766%, through last year’s high of 1.742% set at the end of Q1. The change from the previous Friday was 27 bps. A burst of selling pressure came after Wednesday’s release of December’s FOMC minutes, which contained a discussion of balance sheet reduction. Although Friday’s nonfarm payroll data was weaker than expected at just 199k, the unemployment rate dipped below 4% to 3.9, and yoy Avg Hourly Earnings rose 4.7% vs an expected increase of 4.2%. A ridiculously large jump in November’s Consumer Credit figures (released Friday afternoon) added to a sense of economic imbalance, with a record month of $40 billion, including a $19.8 billion increase in revolving credit (credit cards).
In eurodollars, EDH22/EDH23, the March to March one-year calendar spread, settled at a new recent cycle high for any 1-yr at 98.5. No 1-yr spread has yet exceeded 100 bps in this cycle. I had done a small study of calendars and found that, at the onset of changes in Fed policy, the spreads do a pretty good job of estimating the amount of Fed rate hikes in a given year, at least initially. In Fed funds, the spread from January’22 to January’23 is 83.75 (9991.75 vs 9908.0). This spread is therefore forecasting between 3 and 4 hikes by the end of the year. EDH2/EDH3 is projecting four hikes from Q1’22 to Q1’23. So, a hike at every other FOMC meeting. Given the inflation picture, that seems low. Given what appears to be economic fragility beneath a robust surface, it might even be high. Clearly there was a burst of economic enthusiasm associated with fiscal stimulus, as reflected by Reddit flows into meme stocks, but that magic appears to be dissipating. Is a huge increase in Consumer Credit a sign of confidence going forward? Or a sign that gov’t transfers have run out and now the household sector is degrading what had been solid balance sheets? The broader concern is that if the Fed really begins to withdraw accommodation quickly, perhaps fissures will open into gaping chasms (like Q4 2018).
Considering front end futures pricing. the Fed has the blessing of the market to begin hiking. What has changed to a degree is the curve. The long end priced one hike this week. That is, fives, tens and thirties all jumped around ¼% in yield. (30y rose 22.4 to 2.112%). As these increases flow into mortgage rates, there will likely be a modicum of restraint felt in housing. In my opinion, the market has actually priced a March lift-off too aggressively. It’s very unlikely that hikes would occur at both the March and May meeting. April Fed Funds settled 9970.5 or 29.5 bps vs current Fed Effective of 8 bps. In other words, over 21 bps of a potential 25 bp hike is being priced for the March 16 FOMC. I recall 2015, when almost everyone thought Janet Yellen had set the market up for September lift-off. Pricing then as now reflected high odds of a move, but USD strength and a hard sell-off in emerging markets postponed the initial move until December.
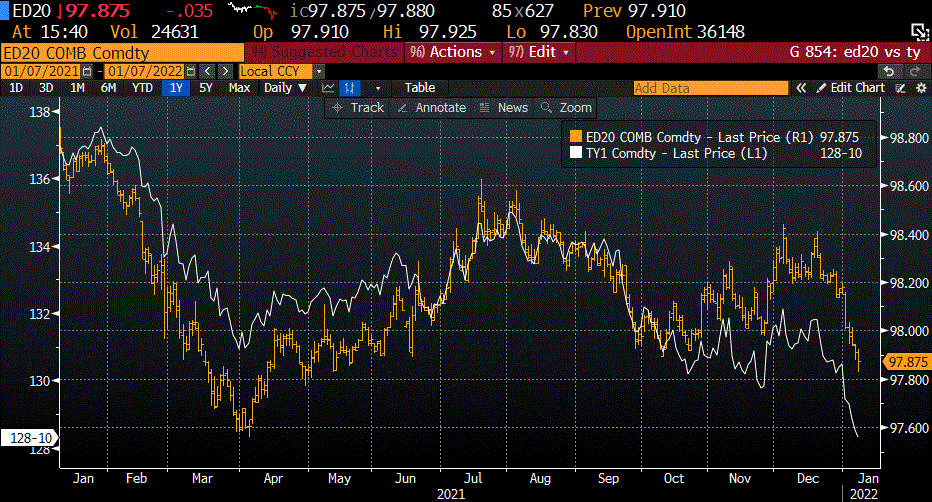
Below is a chart of the rolling active TY futures price in white, versus a chart of the last gold on the Eurodollar strip, which is the 20th quarterly, denoted by ED20, currently EDZ’26. As mentioned above, the cash ten-year treasury yield has pierced last year’s high by a couple of bps. On the chart above, you can see that the white line, which represents the TY closing price, has significantly breached the low from late March around 131-00 (corresponding to the cash yield of 1.74%). But look at the last gold, it’s still about 30 bps away from the March/April low which was sub-9760. (EDZ6 settled 9787). Of course, if I had used a yield chart the disparity wouldn’t be quite as glaring; the TY future has a shorter duration than the 10-yr cash and the flattening from October to mid-December was severe as the market priced front-loaded hikes. The flattening was accentuated after Powell retired “transitory” in late November. On the chart you can see that ED20 rallied 40 bps from 9800 to 9840 from end of Nov to start of Dec. That move has now completely reversed, and then some.
The Fed’s overt acknowledgement that inflation might be something more than transitory, along with the now open possibility that actual balance sheet reduction could occur, supports the idea of bear steepening, of which we’ve had a small taste. This could be one of the trades of the year. We’ve seen heavy accumulation of TYH 127 puts which represent a yield of 1.92 to 1.93% on the ten year. These puts settled 23/64 (~4.5 bps) vs 128-095 and have 266k in open interest, more than double the next closest TY option. TYH options expire Feb 18, and these puts are approx. 16 bps out of the money.
We’ve seen some buying in blue and gold midcurve puts this week, but the chart above makes the idea even more compelling. EDH’25 settled 9794.0. 4EH2 9775 puts which settle to that underlying contract on March 11, are 19 out of the money and settled 8.5. There was a buyer of 4EH 9750 puts last week for 3.0; settled 3.5. There are only about 23k open so far in 4EH puts in total, compared to 540k in 3EH and 300k in 3EM puts. So, liquidity in golds (4E) could be an issue. Additionally, even though a potential Fed move in March should be appropriately priced by the start of the month, March euro$ midcurve puts expire 11-March, the Friday prior to the March 16 FOMC.
Now let’s imagine a scenario where the Fed has cued the market to expect a March hike. The inflation data increasingly supports lift-off (CPI is released Wednesday, with yoy expected 7.0% from 6.8% and Core 5.4%). However, some sort of geopolitical event (Kazakhstan?) causes the Fed to hold. Rather than a flight to quality in the long end, yields surge higher as the curve steepens. Though probably low odds, they’re not zero. There are no April midcurve options open in golds, but there are in blues.
Blue June, EDM’25, settled 9798.0. April midcurves expire 14-April (on Thursday due to Good Friday).
Put settles:
3EJ2 9775.0p 10.75
3EJ2 9762.5p 7.50
3EJ2 9750.0p 5.25 (estimated, not open yet)
3EJ2 9737.5p 3.50
Worth 4 for a 3EJ 9762/9737ps?
This should be an interesting week. Powell is in front of the Senate Banking Committee on Tuesday for his re-nomination, with Brainard to follow on Thursday. CPI is Wednesday, with yoy expected 7%. On Tuesday the Treasury issues $52 billion in 3 yrs. Earlier on Tuesday the Fed buys $4.5 billion in 4.5 to 7 yrs, and $1.6 billion is 22.5 to 30 yrs. On Wednesday $36 billion of 10s and Thursday $22 billion in 30s (re-opens) are auctioned. PPI on Thursday and Retail Sales on Friday.
| 12/31/2021 | 1/7/2022 | chg | ||
| UST 2Y | 72.8 | 86.6 | 13.8 | |
| UST 5Y | 125.6 | 150.2 | 24.6 | |
| UST 10Y | 149.5 | 176.6 | 27.1 | |
| UST 30Y | 188.8 | 211.2 | 22.4 | |
| GERM 2Y | -62.0 | -59.3 | 2.7 | |
| GERM 10Y | -17.7 | -4.3 | 13.4 | |
| JPN 30Y | 68.3 | 71.5 | 3.2 | |
| CHINA 10Y | 277.8 | 281.9 | 4.1 | |
| EURO$ H2/H3 | 86.5 | 98.5 | 12.0 | |
| EURO$ H3/H4 | 41.0 | 53.0 | 12.0 | |
| EURO$ H4/H5 | 9.0 | 10.5 | 1.5 | |
| EUR | 113.73 | 113.64 | -0.09 | |
| CRUDE (active) | 75.21 | 78.90 | 3.69 | |
| SPX | 4766.18 | 4677.03 | -89.15 | -1.9% |
| VIX | 17.22 | 18.76 | 1.54 | |

