I’ll take the Under, Jamie
January 16, 2022- Weekly comment
EDH’22/EDH’23 one-year eurodollar calendar spread settled at 105 bps on Friday, a new high for the cycle for any one-year spread. FFF’22/FFF’23 one-year FF calendar spread settled 94.75 (also a new high, in September it was 20), so the market is settling in on the idea of four 25 bp hikes over the next year, spurred in part by the comments of Fed officials and also by huge inflation data releases this past week (7% yoy CPI). Jamie Dimon on Friday said he wouldn’t be surprised with 6 or 7 hikes by the Fed in 2022. Bill Ackman impetuously tweeted on Saturday that the Fed needs to start with a 50 bp “shock and awe” hike. The front end has become pretty beared-up, with trades like buys of 30k EDJ2 9900/9875 put spread for 1.0 (April expiry on EDM2 which settled 9926.0), and 50k EDU2 9862.5/9837.5 put spread for 2.75 (Sept expiry on EDU2 which settled 9900.5). Consider that the 9900 top strike on the April put spread is over 75bps higher than the current libor setting, so the Fed would have to aggressively raise three times in short order for that trade to play out. It looks like a Bill Ackman trade.
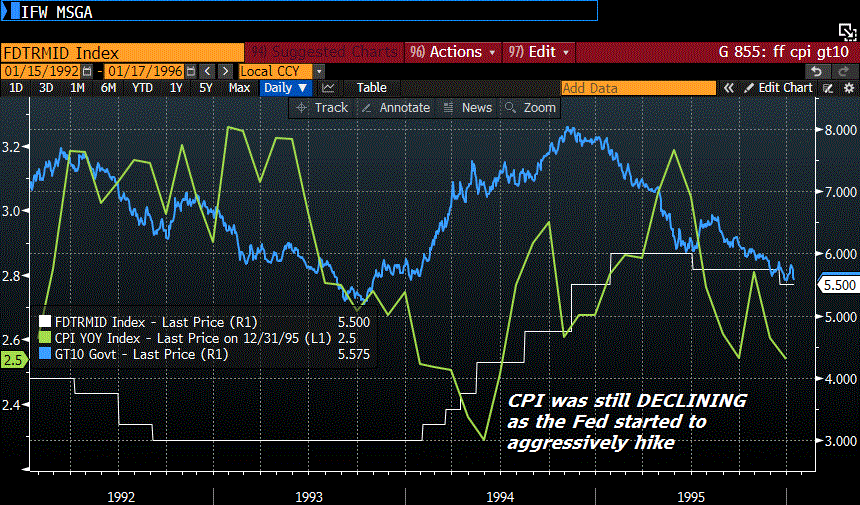
In 2004 the Fed began a hiking campaign that consisted of a 25 bp hike at every meeting for two years. But I briefly went back to examine an earlier hiking cycle, which began in 1994, which was of the aggressive nature that the April put spread buyer would like to see. (Chart below, 1992 to 1995)

At the time, FF had been on hold for over a year at the then-low rate of 3% as shown by the white line on the chart. CPI (green line) was actually trending lower even as the Fed began to hike. There was a shot across the bow 25 bp hike in Feb 1994, followed by two more 25 bp hikes in March and April. In May, there was a 50 bp hike from 3.75% to 4.25% and then another 50 in August. The coup de grâce was a 75 bp zinger in November to 5.5%, which marked the top for long end yields that quickly started to fall. The ten year yield had started 1994 around 5.5%, and topped in late October just above 8%.
It feels as though sentiment is shifting to the idea that a much more proactive Fed could be setting up for something like 1994. But there are a lot of reasons to think that four 25 bp hikes are an absolute maximum for 2022. For example, in 1994 Federal debt to GDP was around 64% versus 122% now. Stock market cap to GDP in 1994 (Wilshire 5000) was around 61% vs 205% now. The state of the economy is highly dependent on asset values, which, according to theory, are tangentially related to interest rates. A decline of 25% in stocks would currently be the equivalent of six months of GDP!
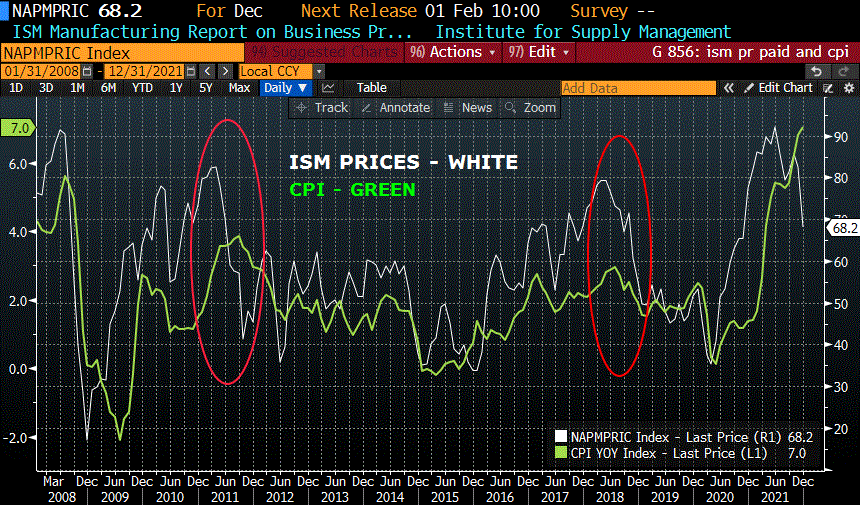
Let’s consider the inflation picture for a minute. My personal belief is that inflation will remain quite high by recent historical standards, but that it will almost certainly decelerate going into the second half of the year. In Jeffrey Gundlach’s latest presentation, he mentioned that ISM Prices almost always lead moves in CPI. I have recreated a chart below, and ISM prices (white line) have clearly rolled over for now. The yoy growth in M2 slowed from a torrid pace of 27% last year to around 12.7% now. Still high relative to past history, but its growth rate will likely decline further with the Fed’s taper.

Finally, China is set to release its Q4 2021 GDP numbers on Monday, with expectations of 3.6%. The yuan has been quite strong, and there is good reason to think that China would favor a weaker currency, perhaps shortly after the Beijing Olympics (Feb 4 to 20) and before the National Party Congress in autumn. My belief is that a weaker yuan would be somewhat deflationary.
This week’s sharp rise in short end rates (2yr note up nearly 10 bps to 96.5) had little impact on the longer end of the curve, where tens and thirties were nearly unchanged at 1.77% and 2.113% both up less than 1 bp. On the euroodollar curve, the March’22/March’23 calendar spread which I mentioned at the top of the note, rose 6.5 on the week to 105.0. But March’23/March’24 actually FELL 5 bps to just 48.0 and March’24/March’25 also fell 5 to end barely positive at 5.5. The back end of the curve will invert if the Fed becomes too aggressive, and that’s why 6 to 7 hikes are NOT in the cards.
| 1/7/2022 | 1/14/2022 | chg | ||
| UST 2Y | 86.6 | 96.5 | 9.9 | |
| UST 5Y | 150.2 | 154.4 | 4.2 | |
| UST 10Y | 176.6 | 177.0 | 0.4 | |
| UST 30Y | 211.2 | 211.3 | 0.1 | |
| GERM 2Y | -59.3 | -58.3 | 1.0 | |
| GERM 10Y | -4.3 | -4.5 | -0.2 | |
| JPN 30Y | 71.5 | 71.7 | 0.2 | |
| CHINA 10Y | 281.9 | 279.2 | -2.7 | |
| EURO$ H2/H3 | 98.5 | 105.0 | 6.5 | |
| EURO$ H3/H4 | 53.0 | 48.0 | -5.0 | |
| EURO$ H4/H5 | 10.5 | 5.5 | -5.0 | |
| EUR | 113.64 | 114.16 | 0.52 | |
| CRUDE (active) | 78.44 | 83.30 | 4.86 | |
| SPX | 4677.03 | 4662.85 | -14.18 | -0.3% |
| VIX | 18.76 | 19.19 | 0.43 | |

