Good news/ bad news
April 26, 2020 – Weekly comment
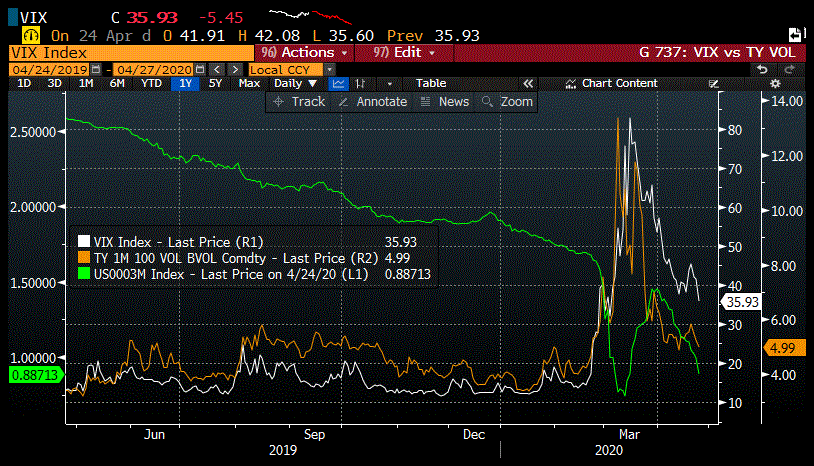
Below is a chart that makes us feel a little bit better about a return to normalcy. The white line is VIX. In March it topped above 80 but on Friday it ended at a new recent low, just a shade under 36. By no means is it close to where it was through the latter part of 2019 when It averaged around 14, but the last month’s trend is encouraging. The amber line is 10y treasury vol. Topped above 13 in March, but is now back to around 5, and below the level of last September during the repo ‘scare’. Of particular interest is the green line, 3 month libor, which plunged in early March, only to explode higher after the March 15 emergency cut to zero served to jolt the realization that credit flows could be severely impaired. Three month libor topped in late March at 1.45% but has eased since then due to heroic measures by the Fed, and is now down to just under 89 bps with the June EDM0 eurodollar contract displaying further confidence, having settled 99.60 on Friday. The only higher settlement in EDM0 was on March 16 at 9961.5.
In a way, these measures are an indication of easing financial stress. The stock market has taken note of the same policy measures and has posted a strong rally off the March 23 low.

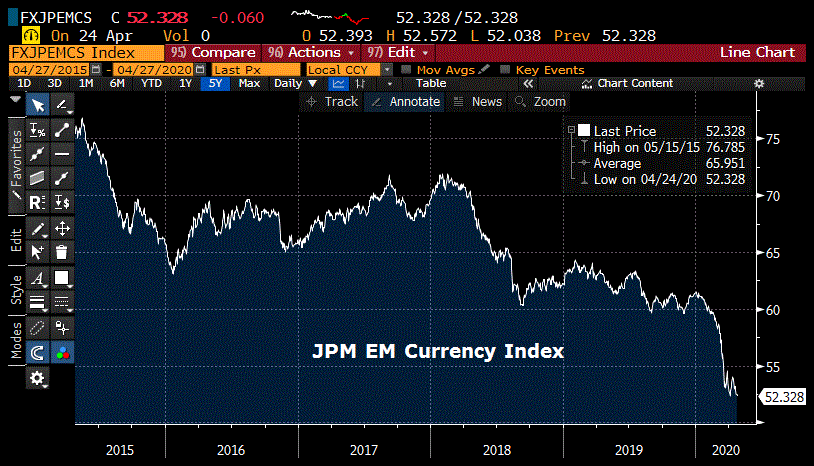
However, many aspects of the current situation remain critical. While SPX has rallied 26% from the March 23 low, the KBE bank index is up only 21% (still down 39% from early Feb high) and XLF is up about 23%. The dollar index is below the late March highs, but what is troubling is the reaction of emerging market currencies which are under severe pressure without the means to raise dollars through trade in order to service dollar denominated debt. Commodity prices are generally in the dirt, and global transport has waned.

Future ability to service/roll debt, even at low rates, is going to be the key issue going forward. Given that global debt levels were at record highs, and US corporate debt was at a record high relative to GDP, it seems quite unlikely that there won’t be a much larger shake-out as the Fed gradually pulls back support. John Mauldin put it this way: “Essentially, many of the loans the Fed was trying to help are going to be downgraded anyway [include munis, MBS]. The Fed’s actions simply kept the price up, but did not increase the companies’ ability to actually service their debt. So, many of the zombie companies will fail anyway.” But it won’t just be “zombies”. Many firms are going to see forward revenues decline significantly whether due to decreased global trade or semi-permanent changes in consumer behavior.
Eurodollar futures and options are telegraphing an outcome that seems somewhat inconsistent with the stock rally. For example, the curve was steepening as the Fed was expected to ease and then actually cut aggressively. The red/green eurodollar pack spread closed around 25 bps on March 18, and red/gold closed just under 62. On Friday the levels were 9.125 and 38.625. The red pack is the average price of the four quarterly contracts one year forward (year 2, or EDM1, EDU1, EDZ1, EDH2) the greens are year 3 and the golds are year 5. I am rounding here, but the reds settled Friday at an average 99.7175 or just over 28 bps, greens at 37 bps, blues (year 4) at 51 bps and golds at 67. The same story of course, is captured in the 5y treasury yield at 36 bps, but the point is that near term flattening is indicating general economic malaise over the next few years. A steeper curve which generates positive carry goes a long way in producing income to offset bad loan losses.
Let’s take a look at week to week changes in some straddle levels on the dollar curve.
| APRIL 17 | APRIL 24 | ^ CHG | |||
| FUTURE PR | ATM ^ | FUTURE PR | ATM ^ | ||
| EDU0 | 99.655 | 0.200 | 99.670 | 0.165 | -0.035 |
| EDU1 | 99.720 | 0.320 | 99.725 | 0.270 | -0.050 |
| EDU2 | 99.615 | 0.630 | 99.650 | 0.505 | -0.125 |
| 0EU0 | 99.720 | 0.195 | 99.725 | 0.155 | -0.040 |
| 2EU0 | 99.615 | 0.280 | 99.650 | 0.240 | -0.040 |
| 3EU0 | 99.460 | 0.360 | 99.510 | 0.320 | -0.040 |
Without much of a week to week change in futures, straddles were crushed, with midcurves losing 4 bps. Especially stark is the change in long-dated straddles, where the long dated EDU22 (876 days until expiry) dropped 12.5 bps on the week with 5.5 of that occurring Thursday to Friday. The green pack 9962.5 straddle strip imploded from 266 bps on April 17, to 213 on April 24!
What’s the signal? It’s like the COVID patient being put on a ventilator. About one-in-five chance of continued viability. The Fed has employed the ventilator for many types of debt. A mechanical means of breathing.
I’ve been in favor of a steeper curve for some time. I think that a precautionary move to build inventory cushions, a trend to bring basic manufacturing back to the US, increased safety costs, and a failure of weaker players to survive, will lead to inevitable price pressures against a background of staggering government debt and deficits. That might be correct. Eventually. It’s not what the market was saying this week.
The coming week should be eventful. 178 companies of the S&P are slated to release earnings. The FOMC meeting and press conference are Wednesday. ECB and BOJ also meet. Treasury issues 2 and 5 year notes on Monday, with 7s on Tuesday. We know that treasury coupons aren’t providing much in the way of income. This week we see which companies can maintain dividends.
| 4/17/2020 | 4/17/2020 | chg | ||
| UST 2Y | 20.4 | 21.2 | 0.8 | |
| UST 5Y | 36.4 | 36.1 | -0.3 | |
| UST 10Y | 65.4 | 59.1 | -6.3 | |
| UST 30Y | 127.4 | 117.1 | -10.3 | |
| GERM 2Y | -67.9 | -70.6 | -2.7 | |
| GERM 10Y | -47.2 | -47.3 | -0.1 | |
| JPN 30Y | 49.6 | 43.4 | -6.2 | |
| EURO$ M0/M1 | -17.5 | -13.0 | 4.5 | |
| EURO$ M1/M2 | 8.0 | 5.5 | -2.5 | |
| EUR | 108.75 | 108.21 | -0.54 | |
| CRUDE (1st cont) | 25.03 | 16.94 | -8.09 | |
| SPX | 2874.56 | 2836.74 | -37.82 | -1.3% |
| VIX | 38.15 | 35.93 | -2.22 | |

