Global Walls
January 17, 2021 – weekly comment
“The treasury market’s bears had better take notice; There’s a wall of global cash poised to swoop in and buy, likely limiting the upside in yields.”
So begins a BBG article from this weekend by Liz Capo McCormick et al, who I respect as a journalist, but I think this piece widely misses the mark. The article cites a couple of asset managers who allow that yields of 1.25 to 1.3% on the ten year may draw buyers, and then falls back on Japan as this supposed “wall of cash”. From a short term perspective I agree that yields have run into resistance, and will likely drift sideways to lower this week. The chart below clearly shows resistance defined by an obvious upward channel. But the fact remains that there is a wall of supply on the way in the form of (continued) monster deficits. At the same time, inflationary signals continue to percolate across markets and the dollar remains vulnerable.
What about domestic buyers? With Fed officials leaving little doubt that rates are on hold, the carry is quite attractive. On top of that, Brainard, Clarida and Powell took pains to squelch any taper talk. From the Chairman:
The economy is far from our goals, and as I’ve mentioned a couple times, we’re strongly committed to our framework and to using our monetary policy tools until the job is well and truly done. The taper tantrum highlights the real sensitivity that markets can have about the path of asset purchases. We know we need to be very careful in communicating about asset purchases… We will, of course, be very, very transparent as we get close. I would just say this on the current situation, when it does become appropriate for the committee to discuss specific dates – when we have clear evidence that we’re making progress toward our goals – and that we’re on track to make substantial further progress towards our goals – when that happens and we can see that clearly we’ll let the world know. We will communicate very clearly to the public and we’ll do so, by the way, well in advance of active consideration of beginning a gradual tapering of asset purchases. So, that’s how we’re thinking about that.
In my opinion the Fed may soon be thinking about how to gracefully ADD to purchases in order to stem yield increases. There’s a lot of geopolitical uncertainty at this time along with constant coverage of virus outbreaks. While I feel the corner has been turned on covid, what’s fairly clear about the Fed is that perceived risks are met with monetary accommodation. The new framework makes it even easier for the Fed to default to ‘downside risks’ in making policy decisions.
I’ve personally been involved in trades where the thinking is “I’m probably ok from here. How much farther can it possibly go?” That is typically a very bad way to trade. You’re already in it and trying to justify to yourself that a turn is near. The answer is, FARTHER. I’ve also had a client use the phrase, “The road to hell is paved with positive carry”. What if, when Powell’s term ends in February of 2022, Biden nominates someone like Shaq? The carry earned over the next year will be but a passing memory.
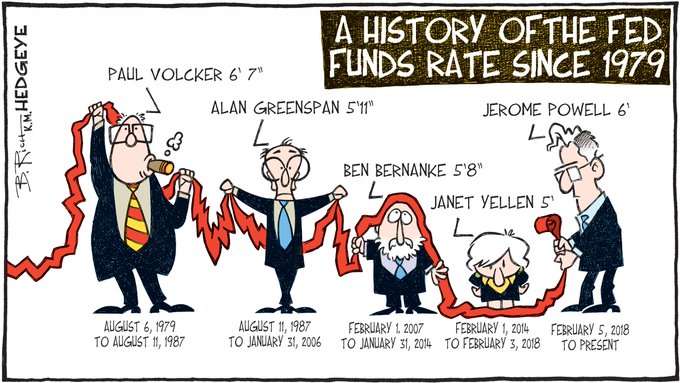
I’m just kidding of course (Shaq is 7’1”). But I am not kidding about the new framework institutionalizing the risk bias toward higher long end rates due to concerns about the Fed’s desire for higher inflation. U of M 1-yr inflation expectations popped up to 3.0% last week; 5-10 yr matched a five year high of 2.7%.
What follows are just a few charts that I’ve highlighted before that indicate to me that a bear market in bonds has commenced. Yes, jobless claims jumped back up to 965k, highest since August. Yes, it’s winter and no one wants to eat outside and all the holiday bar and restaurant parties were cancelled. Retail sales slowed. But pricing indicators seem to be gaining strength.
The first chart is the ten year vs inflation-indexed tip breakeven with the 5y 5y frd inflation swap. Both moving higher. However, Ben Breitholtz from Arbor Research cautions that the 2yr to 10yr tips breakeven has inverted the most since July 2008. He notes that “inflation expectations habitually peaked following inversions.” I can’t seem to replicate his chart; I’m just taking it on faith. The 5y breakeven is 214 to the ten year at 211, so slight inversion exists there.
The next chart is the BBG Ag index, strongly breaking out to the upside, with 2/10 treasury spread, ditto.
It’s reported this week that the largest owner of farmland is none other than Bill Gates at 242,000 acres. Big tech versus real assets. Food security is a huge theme and this guy is exploiting it.
Not pictured, but Gundlach’s copper/gold ratio versus tens seems to forecast outperformance of the former indicating catch-up by the latter. Below is the BBG base metals index and the dollar index. Both seem to be breaking out, though it’s a bit early to draw conclusions on this one. Will be much clearer if 2018 extremes are surpassed.

This week includes the inauguration and a $24 billion twenty year auction on Wednesday.
OTHER MARKET THOUGHTS/ TRADES
On Friday the seller of EDU3 9950 calls continued his campaign, with another 40k sold at 17.5, bringing the cumulative total to at least 115k (total open interest in the strike is 129k). These calls have 974 days until expiration. On Friday, they settled 18.0 vs 9947.5 in the underlying; the 9950 straddle has been crushed, settling at 38.5 vs 42.5 the previous Friday ref 9942.0. If the market were to immediately trade down 40 bps, all else being equal, the calls would be valued just under 10. In three months, if futures remain here, all else equal, decay will provide a profit of 0.7 bps. If futures roll forward as indicated by the EDH3/EDM3 calendar spread at 7.5, then the EDU3 calls will be worth 17.4 in three months. (I am using March/June calendar rather than June’23/Sept’23 which is elevated at 15.5 due to the libor fallback timing). I don’t really see the rationale for clobbering long dated calls at relatively low vols, but would consider something like buying 2EU 9937/9912ps which settled 5.25 if I thought a near term adjustment to higher rates was probable.
Though I think bonds are in a bear market, a corrective rally seems plausible. From last week:
“I would be looking to buy call spreads in tens on weakness. TYG 136.75/137.25 cs settled 10 vs 136-21; I would hope to pay 8 or less there. Expiration is one week from Friday.” Settled 13 vs 136-275.
Goldman has upped its 2021 GDP forecast to 6.6%. US treasury bond vol remains compressed. I believe USH has a bit of room to rally in the early part of the week, to somewhere just above 170, retracing a bit of the damage done by the Jan 6 Dem sweep in Georgia. Look to buy USH put spreads on a rally.
| 1/8/2021 | 1/15/2021 | chg | ||
| UST 2Y | 13.5 | 13.5 | 0.0 | |
| UST 5Y | 48.2 | 45.3 | -2.9 | |
| UST 10Y | 111.5 | 109.5 | -2.0 | |
| UST 30Y | 187.2 | 185.2 | -2.0 | |
| GERM 2Y | -70.1 | -72.0 | -1.9 | |
| GERM 10Y | -51.9 | -54.3 | -2.4 | |
| JPN 30Y | 64.6 | 64.3 | -0.3 | |
| CHINA 10Y | 314.9 | 314.8 | -0.1 | |
| EURO$ H1/H2 | 2.0 | 1.0 | -1.0 | |
| EURO$ H2/H3 | 15.0 | 10.5 | -4.5 | |
| EURO$ H3/H4 | 38.0 | 39.0 | 1.0 | |
| EUR | 122.20 | 120.80 | -1.40 | |
| CRUDE (active) | 52.26 | 52.42 | 0.16 | |
| SPX | 3824.68 | 3768.25 | -56.43 | -1.5% |
| VIX | 21.56 | 24.34 | 2.78 | |

