Forward Guidance from the Market to the Fed: Don’t Get Too Tight
February 13, 2022 – Weekly Comment
As of Friday, the lowest Eurodollar contract on the strip is EDZ’23, at a price of 9772.5 or a yield of 2.275%. Every contract in front is at a lower yield and every contract behind EDZ’23 is at a lower yield, in other words, the curve is inverted from EDZ’23 back. It’s the same on the SOFR curve, EDZ’23 is weakest at 9798.5 and inverts from that point, but I’m sticking with dollars.
On Friday at futures settlement, the ten year yield was 1.944% and the thirty year was 2.254%. So EDZ’23 has a higher yield than everything on the treasury curve except the 20-yr. Typically, a flat or inverted curve is a sign that the Fed is ‘too tight’, yet in this instance the Fed hasn’t even ended QE yet.
From a Jim Bianco tweet:
Final tranche of QE is from Feb 15 to March 10, total $20b. If the FOMC wants to cancel, the most logical time for them to put out an announcement would be Monday before the NYSE open.
I think they should cancel it, but I don’t expect them to.
So, the Fed will be buying bonds on March 10, Feb CPI release date. Inflation could be as high as 8%.
Less than a week later, March 16, is the FOMC meeting when they are expected to raise rates either 25 or 50 bps.
So congratulations to the Fed.
For the first time in history it will be easing and tightening in the same week! And this accomplishment will happen with inflation at a 40 year high near 8%.
On the treasury curve, 2/10 ended at 44 bps, a new low for the year. After the futures close it was 42, as tens were bid due to another warning of imminent Russian invasion of Ukraine. In August of 2018, the low was 19, though the ultimate low came a year later in August 2019 at -5.6, so currently the spread is still nearly 50 bps above the 2019 low. However, the 5/30 spread is just 40, only 20 higher than the previous cycle low which was in July 2018 at 20 bps.
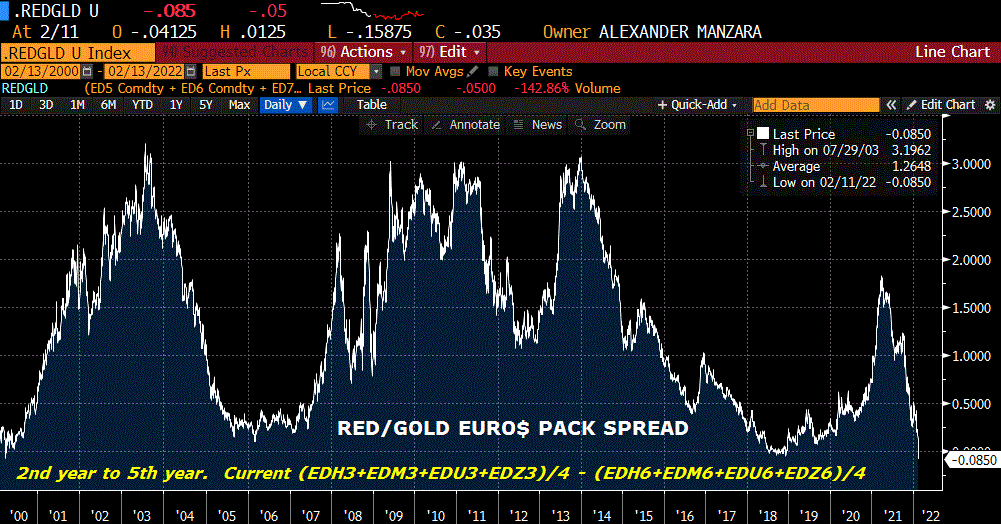
The real eye-popper is the red to gold Eurodollar pack spread (2nd year forward to 5th year forward) which settled Friday at negative 8.5. This is a NEW LOW since the turn of the century. The low in 2018 was -5.625. Some might be tempted to call it an anomaly due to the upcoming SOFR transition, but I would note that each of the golds traded over 50k contracts on Friday, and that open interest is 52k to 80k in each of the four contracts (EDH6, M6, U6, Z6). The average of the four gold contract prices is 9787.125 or 2.13%. That’s a rough one-year rate, 4 years forward. This inversion is a hint that the economy is likely to cool fairly quickly in response to expected Fed hikes (now priced in excess of 150 bps by the end of the year; Jan’23 FF contract settled 98.345 or 1.655%). Amazingly, the red/gold pack spread is signaling that the Fed will be too tight, BEFORE THEY HAVE EVEN BEGUN TO HIKE.

A friend reminded me of the old days (thanks MJ), when we had “Fed watchers” who were paid to interpret monetary policy. At Fed time, 10:30 to 10:40 each day, the time of open market ops, we would wait to see if the Fed did matched sales. If they did, it could be a sign that the Fed hiked. But, it wasn’t always clear. Sometimes there would be disagreement among analysts about whether the Fed really hiked or not. Hence, the Fed watchers, one of whom was David Jones of Aubrey Lanston. I’ve linked an article at bottom, but here’s a quote by Jones about the Fed’s Vice Chair Preston Martin: “Martin was a poor vice chairman for several reasons. He could not hide his ambitions to be chairman, he spoke out of school on internal Fed policies, and he tended to focus narrowly on a few sectors without looking at the overall picture.” Almost sounds like he could be talking about Bullard.
I was standing at an old wooden booth on the west side of the bond pit in the late 1980s. Directly in front of me were the Nolan brothers and Steve Anichini and other pit filling brokers, Steve Phillips, Rob Shatkin. The top step locals on that side of the pit were Dick Pfeil, Kevin Dowdle, Rob Moore and Charlie D. Around the arc of the pit was Dave Ryan, who used to fill orders for Dean Witter. I couldn’t see Ryan from my booth, which didn’t really matter. In fact, what was strange about the CBOT floor as opposed to the CME floor, is that outside clerks and desk brokers couldn’t see into the pit. The pit was elevated and tiered down from a height of about four feet, and we relied on information from the clerks that ringed the perimeter. On the CME floor, desks were tiered up at elevations above the pits. In any case, what I did have a clear view of was John Fife, the main desk broker at Dean Witter. He was always on the line at Fed time, and would frequently blast out large bond orders. That’s when you knew the Fed had done matched sales!
In any case, the mystery surrounding Fed has morphed into excruciating forward guidance, but even the well-intentioned communications policy has recently been botched by the inconvenient acceleration of inflation. Let’s see: yoy gains in BBG Agricultural index of 30%, yoy gain in BBG base metals index 32%, Case Shiller Housing +18%. And suddenly, the market is shocked by a 7.5% CPI print! Wake up and smell the coffee! (Oh, by the way, coffee futures up over 100% yoy).

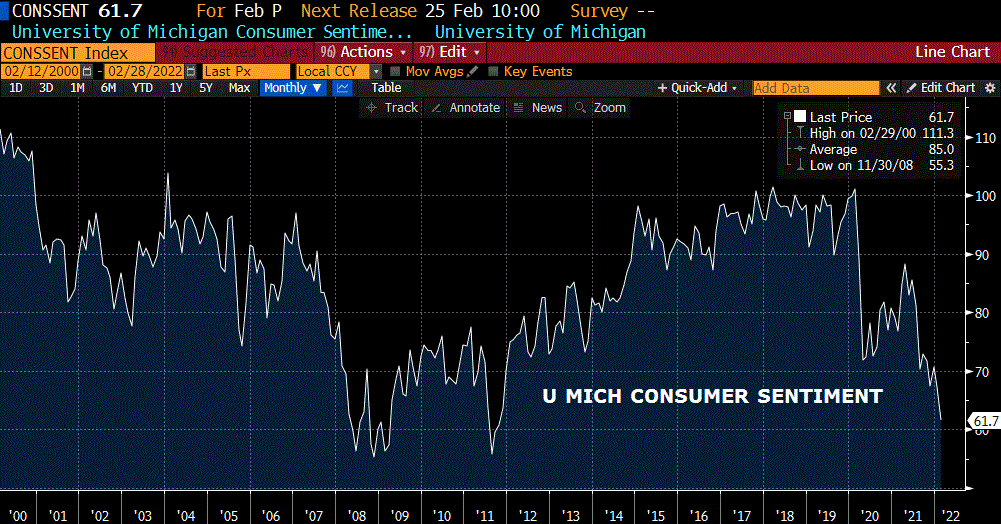
The decline in the University of Michigan Consumer Sentiment report to a decade low of 61.7 bears out the idea that high inflation, and measures taken to quell it, will slow the economy. From the U of M site, quoting survey director Richard Curtin: “Although their primary concern is rising inflation and falling real incomes, consumers may misinterpret the Fed’s policy moves to slow the economy as part of the problem rather than part of the solution.”
OTHER MARKET THOUGHTS/TRADES
Odds of front-loaded Fed tightening increased dramatically this week as Bullard said he’d like to see “100 bps in the bag by July 1.” It’s clear in the table below: the 2-yr yield surged 17.8 bps to 1.50% while tens barely changed on the week at 1.944%, up 1.6 bps. EDH2/EDH3 one-year euro$ calendar jumped 17.5 bps to 139.5, while EDH3/EDH4 plunged 16.5 to just 14 bps. That’s the kind of movement that has led to a shocking increase in implied vol.
Consider the past few sessions at-the-money EDU’22 straddle:
Feb 8, EDU2 9864.0 9862.5^ 49.0
Feb 9, EDU2 9863.5 9862.5^ 48.5
Feb 10, EDU2 9835.0 9837.5^ 64.0
Feb 11, EDU2 9836.0 9837.5^ 75.0
Even with the 25 bp increase in the strike price yield, the increases from Wednesday to Thursday and Thursday to Friday are massive. The Fed Board on Thursday released its hypothetical scenarios for Stress Tests. Short end vol levels suggest that the hypothetical could easily shift towards reality.
I still don’t see the Fed’s semi-annual Congressional Testimony scheduled for the end of February, but Bullard is again on CNBC on Tuesday, and speaks again on Thursday. Mester also on Thursday and Williams discusses the outlook on Friday.
| 2/4/2022 | 2/11/2022 | chg | ||
| UST 2Y | 132.2 | 150.0 | 17.8 | |
| UST 5Y | 178.6 | 185.1 | 6.5 | |
| UST 10Y | 192.8 | 194.4 | 1.6 | |
| UST 30Y | 222.8 | 225.4 | 2.6 | |
| GERM 2Y | -24.7 | -32.4 | -7.7 | |
| GERM 10Y | 20.5 | 29.7 | 9.2 | |
| JPN 30Y | 80.2 | 86.9 | 6.7 | |
| CHINA 10Y | 271.1 | 278.8 | 7.7 | |
| EURO$ H2/H3 | 122.0 | 139.5 | 17.5 | |
| EURO$ H3/H4 | 30.5 | 14.0 | -16.5 | |
| EURO$ H4/H5 | 2.5 | -12.5 | -15.0 | |
| EUR | 114.49 | 113.50 | -0.99 | |
| CRUDE (active) | 92.31 | 93.10 | 0.79 | |
| SPX | 4500.53 | 4418.64 | -81.89 | -1.8% |
| VIX | 23.22 | 27.36 | 4.14 | |
https://www.sun-sentinel.com/news/fl-xpm-1986-06-18-8602050681-story.html

