Feeling the blues
May 28, 2023 -Weekly Comment
*****************
As far as I know, David Zervos, Chief Market Strategist for Jeffries, coined the memorable catchphrase “SPOOs and Blues” a short time after the financial crisis. It’s not always the case, but since the Fed began hiking rates, the two have pretty much traded in tandem, with moves in forward interest rates appearing to lead. (Blues are 4 years forward, SFRM6, U6, Z6, H7).*
Friend JC has steadfastly maintained that the back end of the SOFR curve has played the lead supporting role for stocks. If forward rates are declining that will be a good tailwind for stocks and help juice up discounted forward earnings.
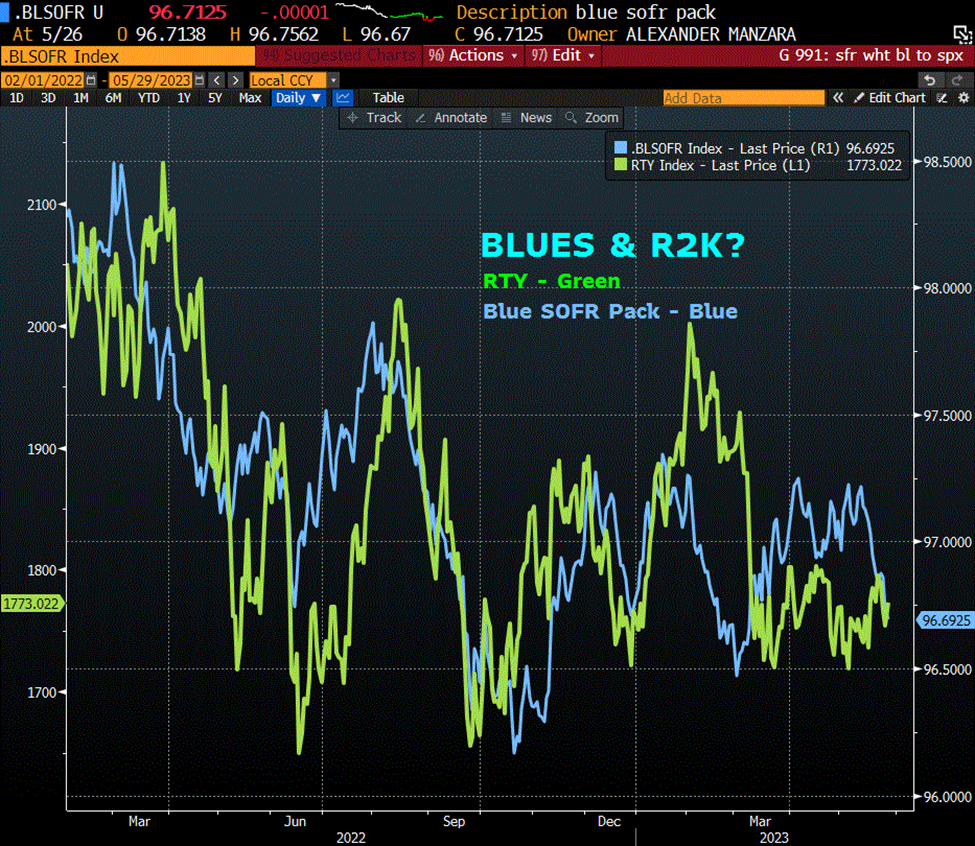
So what happened in May? SPX closed at a new high for the year (thanks NVDA). However, from the high settle on 4-May the blue pack fell over 50 bps, to an average price of 9669.25 or about 3.3%. This calendar year, the 30yr bond has ranged between 3.5% and 4%, edging just above 4 on Thursday. For the past six months the blue pack has ranged between 9730 (2.7%) and 9650 (3.5%). In other words, the four year forward 1-year rate has averaged about 3.1%, 200 bps lower than the current Fed Effective rate of 5.08%. This week appears to have set off a silent warning that stocks are vulnerable to a setback (SPX that is).
However, if you look at blues overlaid with the Russell 2000, the vulnerability is laid bare. That index (R2K) has never really recovered following the SVB revelation that regional banks were walking around naked, having lost the garb of low-cost stable deposits to fund assets backed by CRE. As Warren Buffett might say, the tide has gone out. Depositors have flocked to the high rates and safety of t-bills, with yields likely to be further enhanced by another Fed hike and increased supply once the debt ceiling can pass Congress.
We all know that “stocks” can mean a lot of different things. NVDA added $200 billion in market cap at the end of the week, close to 10% of the TOTAL cap of Russell 2k ($2.6T). Completely reasonable….right?
On the week, US yields soared as inflation data disappointed (Q2 GDP Price index +4.2% and PCE Price Index +4.4%). The two-year (using WI from the previous Friday) rose 33.7 bps to 4.564%. Tens added 12.2 bps to 3.81%. The 2/10 spread is -75 bps. On the SOFR curve, Whites (1st year) down 32 bps with a rounded pack price of 9496, Reds down 33.75 to 9628, Greens down 20.75 to 9671 and Blues down 18.25 to 9669. For this note, I focused on the forward part of the curve embodied by blues, but it’s worth a mention that higher US rates have also boosted DXY from a low near 101 in the beginning of May to 104.20 on Friday, with $/yen 140.60, a new high for the year, highest since last November. August Fed Funds settled 9466.5 or 5.335%, 25.5 bps above the current Fed Effective of 5.08%.
News this week includes ISM Mfg on Thursday and Payrolls on Friday, with NFP expected 190k. The tentative debt-ceiling deal may be put to a vote on Wednesday.
For your holiday barbeque listening enjoyment, here’s a fitting BLUES anthem from Albert King: Born Under a Bad Sign. (Full volume)
“If it wasn’t for bad luck, I wouldn’t have no luck at all”
| 5/19/2023 | 5/26/2023 | chg | ||
| UST 2Y | 422.7 | 456.4 | 33.7 | |
| UST 5Y | 370.5 | 393.2 | 22.7 | |
| UST 10Y | 368.8 | 381.0 | 12.2 | |
| UST 30Y | 394.4 | 396.7 | 2.3 | |
| GERM 2Y | 275.7 | 294.2 | 18.5 | |
| GERM 10Y | 242.7 | 253.8 | 11.1 | |
| JPN 30Y | 123.2 | 124.9 | 1.7 | |
| CHINA 10Y | 271.9 | 272.2 | 0.3 | |
| SOFR U3/U4 | -152.5 | -143.5 | 9.0 | |
| SOFR U4/U5 | -35.0 | -52.0 | -17.0 | |
| SOFR U5/U6 | 2.5 | 1.5 | -1.0 | |
| EUR | 108.06 | 107.29 | -0.77 | |
| CRUDE (CLN3) | 71.69 | 72.67 | 0.98 | |
| SPX | 4191.98 | 4205.45 | 13.47 | 0.3% |
| VIX | 16.81 | 17.95 | 1.14 | |
*A ‘PACK’ is simply the average of the 4 contract prices. The blue pack starts with SFRM26 9670.5, U6 9669.5, Z6 9669.0 and H7 9668.0. The average of the prices is 9669.25.

