Defund the (small) banks
April 2, 2023 – Weekly Comment
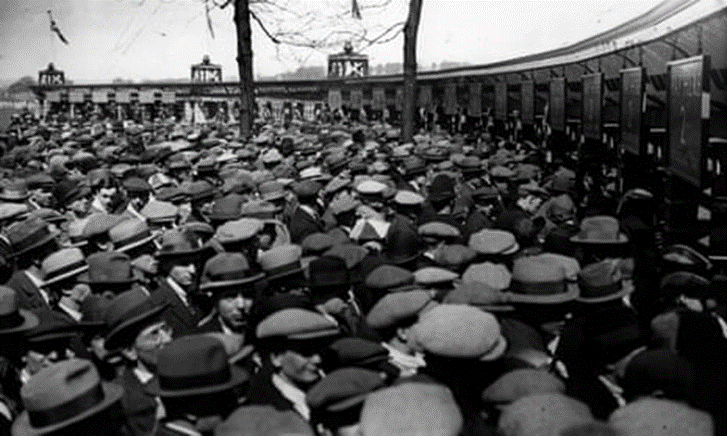
When does the tipping point occur? This photo is from The Guardian, “When and Why did Men Stop Wearing Hats?” I think the hat thing was also a topic in Malcolm Gladwell’s ‘The Tipping Point’. In the photo, every man is wearing a hat. Then it all changes.
I think there are two tipping points relating to SVB. First, savers are much less likely to accept bank yields close to zero. Second, the idea of counter-party risk is growing. While the authorities are doing a decent job of quelling the latter risk, the former appears far more permanent. Money market funds have seen huge inflows, for example. Almost everyone is now aware that deposits can earn a non-trivial yield.
For a long time, there was much lamentation that savers were getting screwed in a world of zero (or repressed) short term rates. Spenders were encouraged. That dynamic has changed, as perhaps indicated by this clip from BBG:
As the Federal Reserve steadily increased the federal funds rate over the last year to try to tame inflation, the average interest rate on loans for new cars jumped to 8.95% last month, up from 5.66% a year earlier, according to researcher Cox Automotive. That, along with average car prices that now approach $50,000, has driven auto loan payments to $784 a month on average, up about $177 a month since March 2020 when the pandemic began.
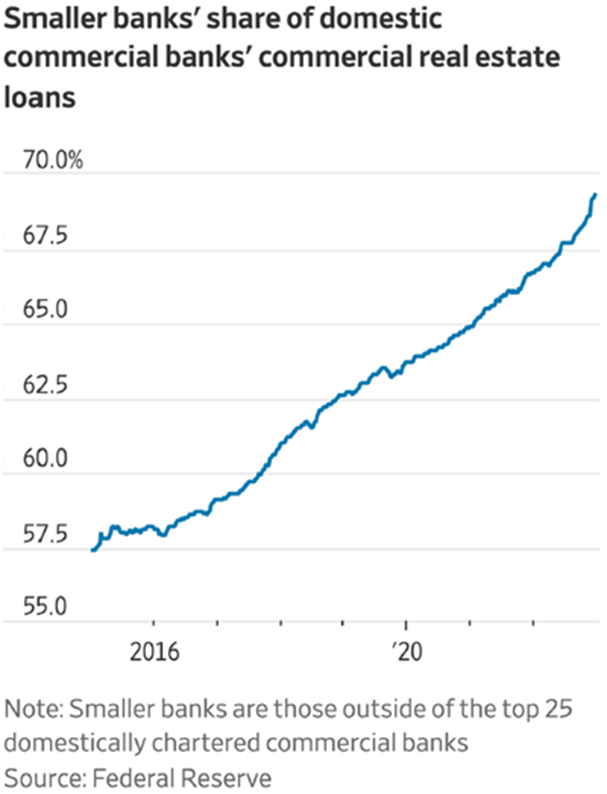
What are the implications going forward? Primarily, a credit crunch, and lower profitability for smaller banks. The Fed has already cited this risk, though the magnitude of the effect is uncertain. I have seen estimates that equate the upcoming credit crunch with 50 to 150 bps of Fed tightening. A chart from Mauldin’s ‘Disturbing Thoughts’ this week points up vulnerabilities:
In terms of the economy as a whole, when does the tipping point occur? I’ve thought that as long as short-term funding rates are below the inflation rate, the plates keep spinning. Prices go up, but wages increase as well, and with funding rates below the gains on either of those two, financing pressures might actually decline. However, as the chart below shows, for the first time in this cycle, the FF rate is above PCE Core prices. If the effect of the credit crunch is 50 bps, then the synthetic midpoint of the FF range would be equal to the cycle-high Core PCE deflator which was 5.4%.
On Friday, the Fed’s Waller gave a speech about the ‘Unstable Phillips Curve’. This curve relates inflation to unemployment. From the speech: “We all know that if you simply plot inflation against the unemployment rate over the past 50 years, you get a blob. There does not appear to be any statistically significant correlation between the two series.” He then goes on to introduce inflation expectations as a determinant for shifting of the Phillips curve and concludes it’s possible “…inflation can be brought down quickly with relatively little pain in terms of higher unemployment.” Note that the U of Mich 1-yr inflation expectation release last week came in at 3.6%, a new recent low and well off the 5.4% high last year. From 2015 to 2020 this survey averaged around 2.7% (high of 3% low of 2.2%). All that Waller’s speech really accomplished in my view is to confirm that the Fed is grasping for explanations, trying to find narratives to fit the data while fending off political attacks, and thus has become more dependent on actual data releases.

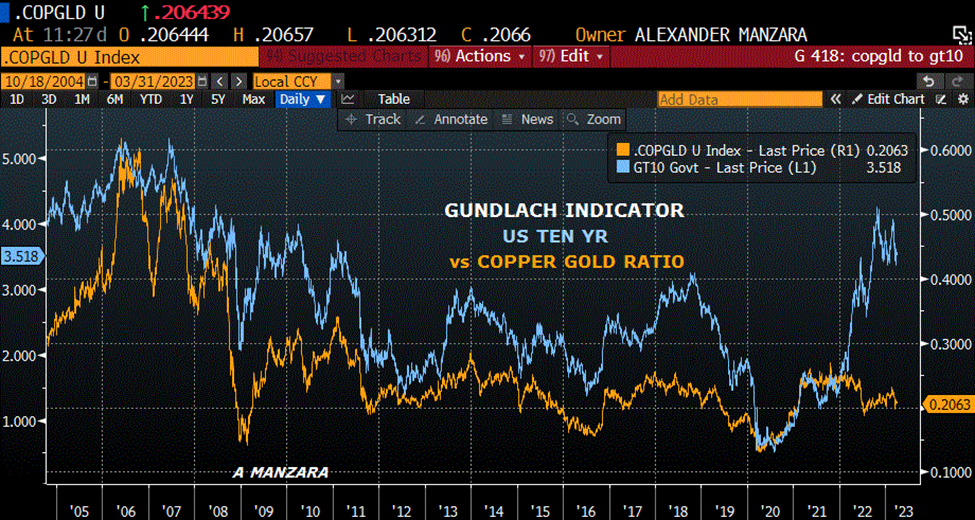
Below I have included a couple of charts related to Gundlach of Doubleline, the copper to gold ratio vs the ten year yield. For the former, I just use HG1/GC1 which is an adequate representation over time. This ratio indicates that the ten year yield likely has room to fall. Copper represents an industrial metal, while gold tends to firm when there are cracks in the financial architecture. The decline in the ratio suggests that yields should decline both due to economic weakness and, perhaps, because of a flight-to-safety. However, relatively high inflation levels are holding yields higher for the time being.
I’ve added the KRW bank index on the lower chart. This index has retraced about half of the move from the GFC low to the high set in the beginning of last year. Large drops in the bank index are typically associated with large declines in the ten-yr yield.

OTHER THOUGHTS / TRADES
The two-year yield rebounded over 30 bps on the week to end 4.062%, while the 30yr rose only 5 bps to 3.692%. Range on 2/30 for the month of March was an astonishing -118 to -13.
There were a few significant exits on Friday. A seller of 40k TYM3 111.5/113.5cs around 1’27; settled 1’30 ref 114-295. Originally bought on March 8, near the lows of the move in TY. TYM3 112/114cs likewise sold at 1’20 to 1’19 in size of 15k; settled 1’24. There was a buyer of 22k SFRZ3 9550/9500/9450p fly for 11-11.5; settled 11.0 ref 9570.0. Appears to be an exit, perhaps by a market maker.
This week brings ISM Mfg (Monday), and Services (Wed). The employment report is released on the holiday-shortened session Friday. Futures settlements to determine in-or-out-of-the-money strikes will occur 10:00 am Chicago time. Trading will cease at 10:15. NFP expected 240k. Unemployment rate expected 3.6%.
FFK3 settled 9506.0. The FOMC is May 3. I calculate Friday’s settle as almost exactly 50/50 odds for a 25 bp hike. No hike =9517.0, hike 25=9494.4.
| 3/24/2023 | 3/31/2023 | chg | ||
| UST 2Y | 372.5 | 406.2 | 33.7 | |
| UST 5Y | 340.0 | 361.5 | 21.5 | |
| UST 10Y | 338.0 | 349.4 | 11.4 | |
| UST 30Y | 364.3 | 369.2 | 4.9 | |
| GERM 2Y | 239.2 | 268.3 | 29.1 | |
| GERM 10Y | 212.9 | 229.2 | 16.3 | |
| JPN 30Y | 132.3 | 124.2 | -8.1 | |
| CHINA 10Y | 287.0 | 285.8 | -1.2 | |
| SOFR M3/M4 | -145.0 | -131.0 | 14.0 | |
| SOFR M4/M5 | -31.0 | -57.5 | -26.5 | |
| SOFR M5/M6 | 4.5 | -5.5 | -10.0 | |
| EUR | 107.62 | 108.73 | 1.11 | |
| CRUDE (CLK3) | 69.26 | 75.67 | 6.41 | |
| SPX | 3970.99 | 4109.31 | 138.32 | 3.5% |
| VIX | 21.74 | 18.70 | -3.04 | |
https://www.federalreserve.gov/newsevents/speech/waller20230331a.htm

