Curve 4th Turn
December 27. 2020 – Weekly note

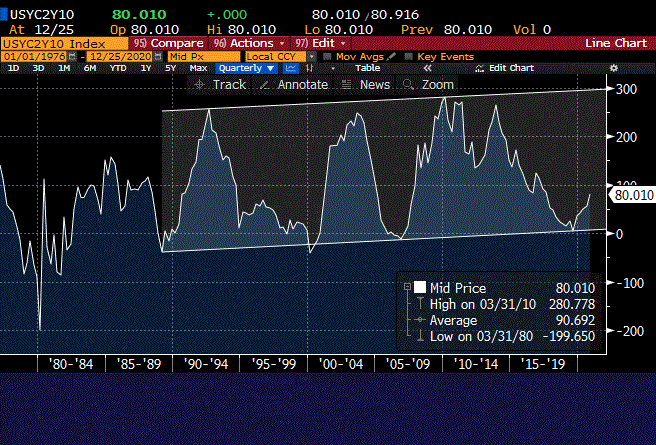
Above is a long-term chart of the 2/10 treasury spread. Easily identifiable thirty-plus year range with three distinct 300 bp surges. The first starts in 1989 and tops in 1992, associated with the Savings and Loan crisis and the Gulf War. Over this time frame the Fed cut the FF target from 9.75% to the then historic low of 3% in Q3 1992. The peak of 2/10 coincided almost exactly with the last ease. Throughout 1993, the rate was 3%.
The second surge goes from Q2 2000 to Q3 of 2003. The main factor was the bursting of the Nasdaq bubble and of course, 9/11. In 2000, the FF target was 7.5%. By June 2003 it was cut to the then historic low of 1% where it remained for the next ten months. The curve peaked within a couple of months of the last ease, topping in September 2003.
The Great Financial Crisis sparked the third surge, from the end of 2006 to Q3 2010. Beginning in Q3 2007 the Fed cut the target from 5.25% to zero by the end of 2008. It took another year and a quarter for the curve to top.
Armed with only this information and this chart, one could easily draw several conclusions about the future. 1) we’re in a ‘fourth turning’ where the 2/10 spread will claw its way back to 300. 2) some sort of bad financial juju is going to be associated with the next couple of years. 3) the Fed is going to ease.
The problem, of course, is that the FF target is already at the lower effective bound. This leaves the Fed with a couple of alternatives: First, quantitative easing and second, targeting a much lower value for the US dollar on global markets. The choice, of course, appears to be “both”.
From 1995 to the middle of 1996 there was a wiggle higher in the curve as the Fed cut rates from 6.0 to 5.25%. The magnitude of that steepening was slightly less than the current one, but it also started at a marginally higher level. Is the current move analogous to that one, or can the Fed do “whatever it takes” to undermine the dollar and generate inflation, thereby vaulting the 2/10 curve to 300 once again? I would suggest the latter.
Surge number one took 39 months from bottom to top. Surge number two took 36 months. Surge three took 36 months. The bottom of the current move was August 27. 2019. It has been in effect for 16 months. Friday’s close was just over 81 bps. We should be near 300 sometime around Q3 of 2022.
In terms of a bad financial catalyst, of course we have the Covid situation which has sparked massive monetary and fiscal accommodation. I can’t help but feel as if the Nashville bombing is also the start of something larger. The recorded warnings pre-explosion suggest communication infrastructure was a target, differentiating this from a terrorist attack. Recent cyber hacks of critical systems, and the fact that the FAA has closed down airspace around downtown Nashville and said that “deadly force” could be used on any security threat increases the level of concern.
OTHER MARKET THOUGHTS/ TRADES
The treasury auctions 2s, 5s and 7s on Monday and Tuesday in total size of $176 billion. Demand for a safe harbor will likely allow clear sailing for these issues. but the massive size in a holiday shortened week where many have closed the books could still cause a hiccup.
The theme of large trades last week suggests that 5 and 10 yr futures will sit in a tight range the next couple of weeks. Large trades include a buyer of 20k FVH 125.75/126/126.25 call tree for 0.5; settled 1.0 vs 126-02. Buyer of 50k TYH 138/137/136.5 put tree for 6; settled 7 vs 137-28. Buyer of 50k TYG 138/137p 1×2 for 6; settled 11 vs 137-28.
| 12/18/2020 | 12/24/2020 | chg | ||
| UST 2Y | 12.1 | 12.1 | 0.0 | w/I 12.7 |
| UST 5Y | 38.0 | 36.9 | -1.1 | w/I 38.2 |
| UST 10Y | 94.6 | 93.3 | -1.3 | |
| UST 30Y | 169.8 | 167.1 | -2.7 | |
| GERM 2Y | -72.5 | -70.5 | 2.0 | |
| GERM 10Y | -57.1 | -54.8 | 2.3 | |
| JPN 30Y | 62.4 | 62.4 | 0.0 | |
| CHINA 10Y | 330.2 | 322.9 | -7.3 | |
| EURO$ H1/H2 | 2.5 | 2.0 | -0.5 | |
| EURO$ H2/H3 | 8.5 | 8.0 | -0.5 | |
| EURO$ H3/H4 | 30.0 | 30.0 | 0.0 | |
| EUR | 122.58 | 122.15 | -0.43 | |
| CRUDE (active) | 49.24 | 48.23 | -1.01 | |
| SPX | 3709.41 | 3703.06 | -6.35 | -0.2% |
| VIX | 21.57 | 21.53 | -0.04 | |

