Conundrum
July 23, 2023 – Weekly Comment
**********************************
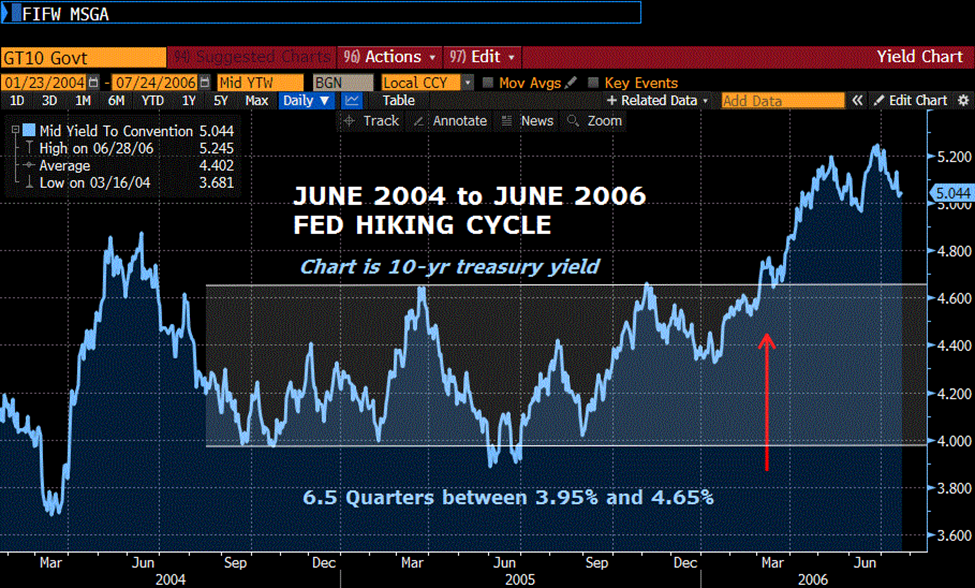
Below I have posted a couple of charts on the US 10 year yield. The top one is from the Fed’s 2004 to 2006 hiking cycle, when the Fed hiked 25 bps at every meeting from 1% to 5.25%.
It was February 16, 2005 when Greenspan gave his famous “conundrum” speech. By that time, the Fed had hiked by 150 bps. The ten-year yield was 4.15% and FF were 2.50%. Greenspan was confounded that rates on the forward part of the curve weren’t going up:
For the moment, the broadly unanticipated behavior of world bond markets remains a conundrum. Bond price movements may be a short-term aberration, but it will be some time before we are able to better judge the forces underlying recent experience.
[Speech is linked at bottom]
After Greenspan’s speech, tens did rise in yield to around 4.65%, but then fell back to new lows, sub-4%. It wasn’t until near the end of the hiking cycle, in March 2006, that yields broke out of the 70 bp range (3.95/4.65) of the preceding one-and-a-half years. In April the yield finally exceeded the high corresponding with the beginning of the hiking cycle. NOTE: high so far from last October is 4.245%
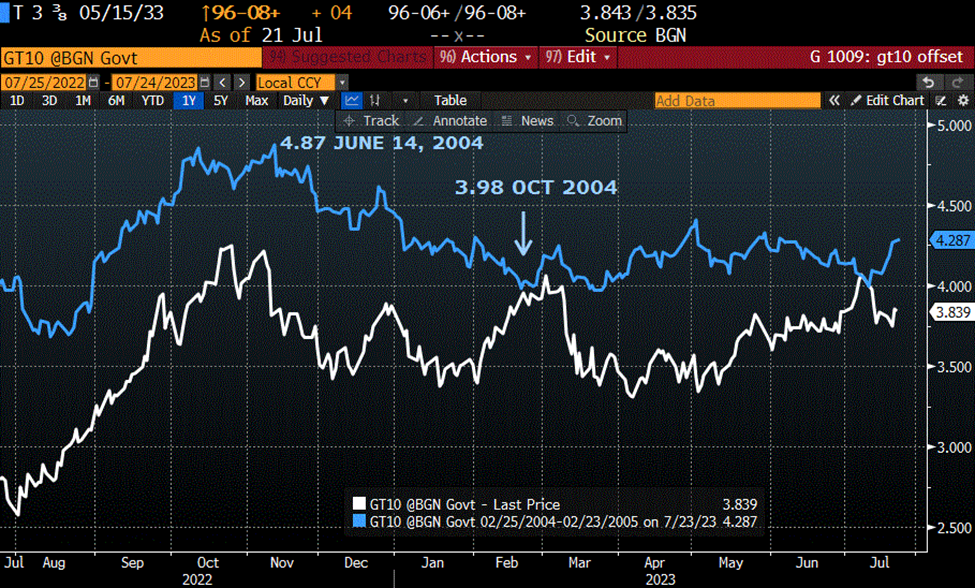
Below the longer time-frame chart which encompasses the entire 2004 to 2006 experience, I plot a rough comparison between the current 10y yield in white, starting in late July 2022, and in blue, starting from around February 2004. The current episode high was 4.245% in late October 2022, about 60 bps lower than the high in June 2004. In the nine months since November 2022, the ten year has ranged from around 3.35% to 4.05%, essentially the same 70 bp range as occurred during the conundrum years, though shifted 60 bps lower.
This rate hike cycle has been significantly speeded up. As Bernanke said, next week’s rate hike could very well be the last. Rather than a slow-drip two year grind, this one has taken only one-and-a-quarter years. Recall it was near the end of the 2004/06 rate hike episode that tens finally broke out to the upside. Will it be the same this time? There are certainly a lot of conundrums associated with markets in the current environment. What is worth noting is that the 2/10 treasury spread in 2006 was around 20 bps on either side of zero, bottoming in November at -19 (several months after the final hike). Currently 2/10 is near historic lows at -100 bps (4.84/3.84), so from that standpoint, the ten year yield has a LOT of upside room just to get back to the 2006 midpoint of zero (on 2/10) even if the two year yield declines somewhat. If we stick with the 60 bp differential from 2004/06 then the top yield would be 4.65 to 4.70.
Above chart is 10y yield through the 2004 hike cycle and just beyond, from Feb 2004 to July 2006, Below in blue is the 10y yield from Feb 2004 to Feb 2005, and the current 10y in white from July 2022 to now.
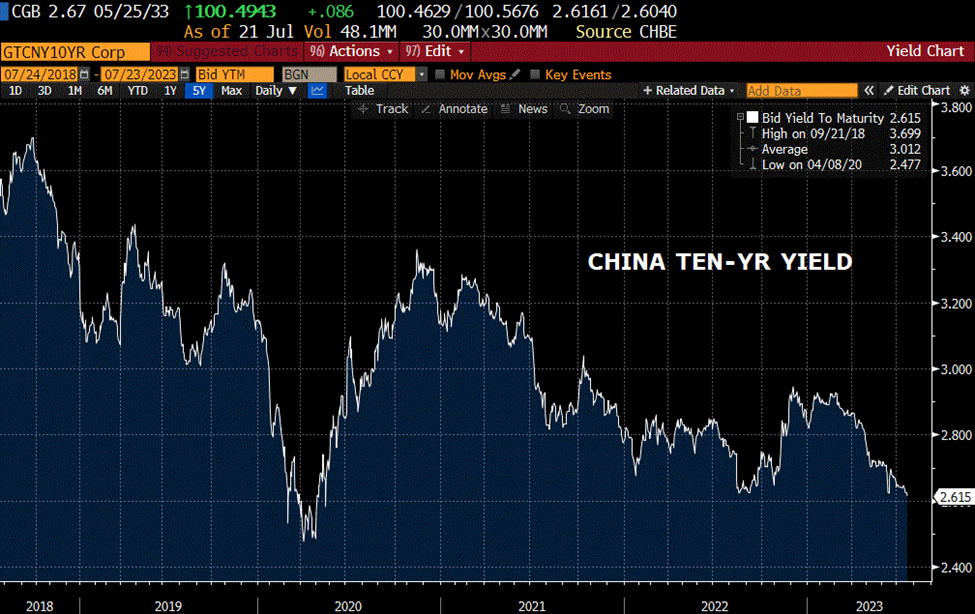
Although Greenspan mentioned “world bond markets” in his 2005 speech, it’s unlikely that any consideration was given at that time to China’s bond market. Rather there was this line: “There is little doubt that, with the breakup of the Soviet Union and the integration of China and India into the global trading market, more of the world’s productive capacity is being tapped to satisfy global demands for goods and services.” How things change.
In any case, I post here without comment, China’s ten-year yield at 2.61%. Near the 2020 low. Doesn’t exactly reflect economic vibrancy.
There has been a decent amount of consideration given to lags in the economy as described by Friedman. Both Powell and Waller have suggested that lags are much shorter now, and that adjustments occur based on the Fed’s forward guidance rather than actual official rate changes. Perhaps there’s a bit of truth to that, but also a modicum of hubris. Contrast that to Ueda, who facetiously suggested the lag in Japan’s case is about 25 years. In any event, here’s an example of what might be considered a lagged response to inflation’s resurgence:
From Bloomberg, July 20 (cited by Credit Bubble Bulletin)
“More than 650,000 American workers are threatening to go on strike this summer — or have already done so — in an avalanche of union activity not seen in the US in decades. The combined actors and writers strikes in Hollywood are already a once-in-a-generation event. Unions for United Parcel Service Inc. and Detroit’s Big Three automakers are poised to join them in coming weeks if contract negotiations fall through… And while logistics experts and financial analysts expected the Teamsters to reach a deal with UPS, their confidence has dwindled as the July 31 deadline approaches. ‘This will be the biggest moment of striking, really, since the 1970s,’ said labor historian Nelson Lichtenstein, who directs the University of California, Santa Barbara’s Center for the Study of Work, Labor and Democracy.”
Wage push inflation? 650k is a pretty large number.
This week:
Monday – global PMIs, Chgo FED Nat’l Activity. 2y auction
Tuesday – Philly Fed Services, Consumer Confidence. 5yr auction. Alphabet and MSFT report
Wed – New Homes, FOMC. Meta reports
Thur – ECB. Q2 GDP expected 1.8%. Job Claims. 7yr auction. META reports
Friday – BOJ. Emp Cost Index, PCE deflator yoy 3.0 from 3.8 and Core 4.2 from 4.6
| 7/14/2023 | 7/21/2023 | chg | ||
| UST 2Y | 474.7 | 484.4 | 9.7 | |
| UST 5Y | 402.9 | 409.3 | 6.4 | |
| UST 10Y | 381.6 | 384.0 | 2.4 | |
| UST 30Y | 392.1 | 390.6 | -1.5 | |
| GERM 2Y | 321.0 | 309.3 | -11.7 | |
| GERM 10Y | 251.2 | 246.9 | -4.3 | |
| JPN 30Y | 138.2 | 132.5 | -5.7 | |
| CHINA 10Y | 264.7 | 261.5 | -3.2 | |
| SOFR U3/U4 | -123.5 | -106.5 | 17.0 | |
| SOFR U4/U5 | -76.0 | -84.0 | -8.0 | |
| SOFR U5/U6 | -13.0 | -17.5 | -4.5 | |
| EUR | 112.26 | 111.26 | -1.00 | |
| CRUDE (CLU3) | 75.32 | 77.07 | 1.75 | |
| SPX | 4505.42 | 4536.34 | 30.92 | 0.7% |
| VIX | 13.34 | 13.60 | 0.26 | |
https://www.federalreserve.gov/boarddocs/hh/2005/february/testimony.htm

