Colder by the Lake
May 1, 2022 -Weekly Comment
We’ve entered that phase of the year when every kid from the west suburbs of Chicago used to hear this from their moms if they were going downtown, “Take a coat. It’s colder by the lake.” It’s a bit of sage insurance advice. Oak Park, where I grew up, is about nine miles due west of the Lake Michigan shoreline, and the difference in springtime temperatures could easily be 10 degrees.
Here are a few ytd percentage changes in equity indices:
DJIA down 9.4%
DJT down 9.8%
SPX down 13.3%
R2K down 17%
Nasdaq down 21%
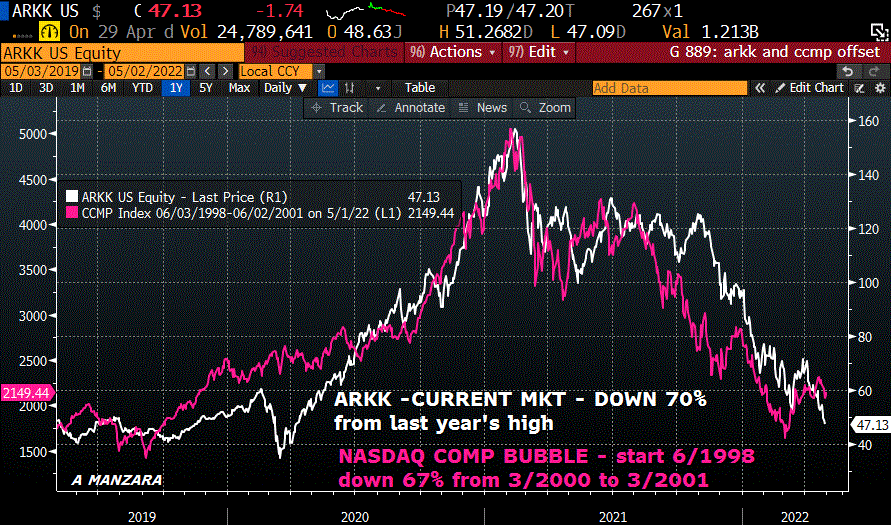
The colder lakefront temperatures are currently associated with “innovation” and “disruptors” in today’s stock market. If you didn’t already have some insurance in the form of puts, it might be a bit late now (or might not), as highlighted by the chart below. It’s the ARK Innovation fund pictured over the date range of May 2019 until now. From its high in the beginning of 2021 until Friday it lost 70% of its value, pretty much a full round-turn from pre-covid. Overlaid in pink is the Nasdaq “bubble” from June 1998 to June 2001. From its high in March 2000 to its low a year later, it fell 67%. Unfortunately, the March 2001 low was not the ultimate low, that came over a year later in October 2002 at 1114, which was another 30% lower than the March 2001 low of 1639.
Investors tend to get giddy when they’re presented with new innovations, and they tend to overlook possible obstacles and competitive challenges, especially when there are no funding hurdles. In hindsight, the “innovation” of 2020 was the overwhelming stimulus from the Federal Gov’t and from the Federal Reserve. It has now gone into reverse-novation. It’s little wonder that Q1 GDP was -1.4% though it was expected +1.2. Stimulus checks ran out. Debt and rent forbearance are over. Yoy growth in M2 had surged over 26% in the beginning of 2021 and is now 8.6%, still high, but much closer to pre-pandemic levels. Inflation expectations have shifted higher. A more stagflationary period appears to be ahead, as reflected by the negative Q1 GDP number with PCE deflator released the following day at 6.6%. The state of the equity market was aptly described by Charlie Munger, “We have people who know nothing about stocks being advised by stock brokers [TV commentators] who know even less.”
On Wednesday, Powell has an in-person press conference following the FOMC announcement. His job is to underpin the Fed’s commitment to anchored inflation expectations, which have floated well away from the pier. On November 11 of last year Powell retired “transitory” from the Fed’s lexicon of price pressures. At the Dec 15 FOMC, he advocated a “gradual pace of firming” but also opined “I wouldn’t say we’re behind the curve” in response to a reporter’s question. In support of a more hawkish tilt, he mentioned the ECI, (Employment Cost Index) released just before the Nov 3 FOMC, the strong employment report two days after the meeting and the CPI report which followed a week later. At that time QoQ ECI was 1.2%, and last week it was reported at a record 1.4% for Q1 22. The CPI report cited by Powell was 6.2% (released 11/10) but is last at 8.5%. The unemployment report was 4.6% (on 11/5), but last at 3.6%. In December the projections for year-end 2022 were as follow: Fed Funds 0.9%, PCE prices 2.6% and GDP 4%. At the last meeting in March: FF 1.9% (up to 2.8% by the end of 2023), PCE prices 4.3% and GDP 2.8%. There are no projections at this meeting, but the January 2023 FF contract, which prices the end of 2022, is currently 9717 or 2.83%, a full year ahead of schedule.
In short, the data has become much more challenging for the Fed, using Powell’s own guideposts. In 2018, it was the 20% drop in SPX from October to the end of December that sparked an end to the Fed’s tightening. From this year’s high on January 3 of 4796, a 20% drop would be 3837. We’re now 4132. However, re-anchoring inflation expectations, which the Fed has repeatedly said it has the tools to accomplish, means ignoring asset prices. We’ll see if the Fed can stand the pressure around SPX 3800, especially in light of headlines like this: “Top Five U.S. Stocks Lose $1.2 Trillion in Value in April.”
Some commentators are saying that last week’s stock market sell-off was due to fears of a 75 bp move at this week’s FOMC. If the Fed hikes 50, the projected level for May Fed Funds (FFK2) would be 9923.5. Friday’s settle was 9921.5. A hike of 75 would put FFK2 at 9902.0. It’s pretty clear that the market is NOT expecting 75 at this meeting, pricing just reflects someone bringing a light jacket.
It does, however, remain abundantly clear that the market has accepted the Fed’s prescription of front-loaded hikes. EDM2/EDU2 three month Eurodollar calendar settled at a new high of 83.5 on Friday (9807.5/9724.0). EDM2/EDM3 one-yr calendar settled 168.5. So the three month spread is nearly half the one-year spread. That’s a FRONT LOAD. In fact, EDM’23 is (still) the lowest contract on the ED strip at 9639.0 or 3.61%, while on the SOFR strip it is also SFRM’23 at 9672.0 or 3.28%. Contracts following June’23 are at successively higher prices / lower yields. The message is that the market puts the terminal rate at 3.25 to 3.5% which, by extension, is the level at which inflation is eventually tamed in a stagnant growth environment.
| 4/22/2022 | 4/29/2022 | chg | ||
| UST 2Y | 267.0 | 269.6 | 2.6 | |
| UST 5Y | 293.3 | 291.6 | -1.7 | |
| UST 10Y | 290.2 | 288.7 | -1.5 | |
| UST 30Y | 294.7 | 294.7 | 0.0 | |
| GERM 2Y | 27.6 | 26.1 | -1.5 | |
| GERM 10Y | 97.0 | 93.8 | -3.2 | |
| JPN 30Y | 101.4 | 96.2 | -5.2 | |
| CHINA 10Y | 284.5 | 284.0 | -0.5 | |
| EURO$ M2/M3 | 171.5 | 168.5 | -3.0 | |
| EURO$ M3/M4 | -38.0 | -39.0 | -1.0 | |
| EURO$ M4/M5 | -21.5 | -16.5 | 5.0 | |
| EUR | 107.90 | 105.46 | -2.44 | |
| CRUDE (active) | 102.07 | 104.69 | 2.62 | |
| SPX | 4271.78 | 4131.93 | -139.85 | -3.3% |
| VIX | 28.21 | 33.40 | 5.19 | |

