Brief note
January 1, 2023 – Weekly comment
There’s a LOT of end-of-year summaries, and a lot of forward projections circulating around. It’s a bit overwhelming. Or perhaps tedious is a better word. I’m just going to keep this note brief and highlight short-end changes over the past week or two.
On the week, I marked the US ten-year up about 10 bps to 3.84% (+2.35% on the year) and the German bund up 17 to 2.57% (+2.75% on the year). I would note that China’s 10y is nearly unchanged on the year, at 2.84%. Japan’s decision to raise the cap on the 10y JGB is still filtering through markets, as is ECB hawkishness. The related move I am going to cite is in near calendars in SOFR futures.
On the week SFRH3/SFRH4 ROSE 10.5 bps to -77.5, while SFRH4/SFRH5 FELL 8 bps to -88.5. These directionally opposite changes reflect relative weakness in SFRH4 or reds in general. The inversion of 2023 contracts to 2024 remains, but has lessened. While there is a clear bias toward easing, it is being pushed back in time a little bit. For example on Dec 23, there was a large buyer of SFRM3/U3 at -19. On Friday it settled -14.5 (9504/9518.5), while SFRH3/M3 settled +4.5 (9508.5/9504). If prospects for rate cuts vanish going into the second half, then M3/U3 should move into positive territory, where H3/M3 is currently.
Typically, when the Fed eases it happens pretty quickly, and rate hikes are slower and more methodical. This past year the hikes were aggressively fast. And now the easing schedule is becoming more tentative?
SFRH3 fell 3.5 on the week, from 9512.0 to 9508.5.
SFRH4 fell 14.0 on the week, from 9600.0 to 9586.0 (largest decline, same as Z3)
SFRH5 fell 6.0 on the week, from 9680.5 to 9674.5
The lowest contract on the SOFR futures curve is M3 at 9504.0. The highest is Z5 at 9682.0. The difference over that two and a half year period is 178 bps. The change in Fed Funds over the past year has been 425 bps.
The “easy” trade is to just stay with a short in Z3 or H4 and watch it roll down the curve as the Fed either continues to hike or at the very least holds rates steady over the year. It’s not that easy.
In terms of year end prognostications, SFRZ3 settled 9547.0 or 4.53%, and the 9550 straddle at 100. There. That’s the prediction: 4.5% overnight rate (maybe 25 bps above the current target) plus/minus 100. The big shops are spending a lot of time on this stuff, writing long papers with charts. “Here comes two words for you” as Jack Walsh says in Midnight Run.
A caveat. Last year on 12/31/21 EDZ’22 was 9895.5. Final settlement for the contract: 9526. A change of 369.5.
Data this week includes:
Wed: ISM Mfg. Last was 49.0, a new low for ‘22 and low since mid-2020 covid period. Expected 48.5
JOLTS 10m expected from 10.3
FOMC minutes for December
Thursday: Job Claims expected 230k
Friday: NFP expected 200k, 3.7% Unemp rate
ISM Services expected 55
January 12 is CPI release

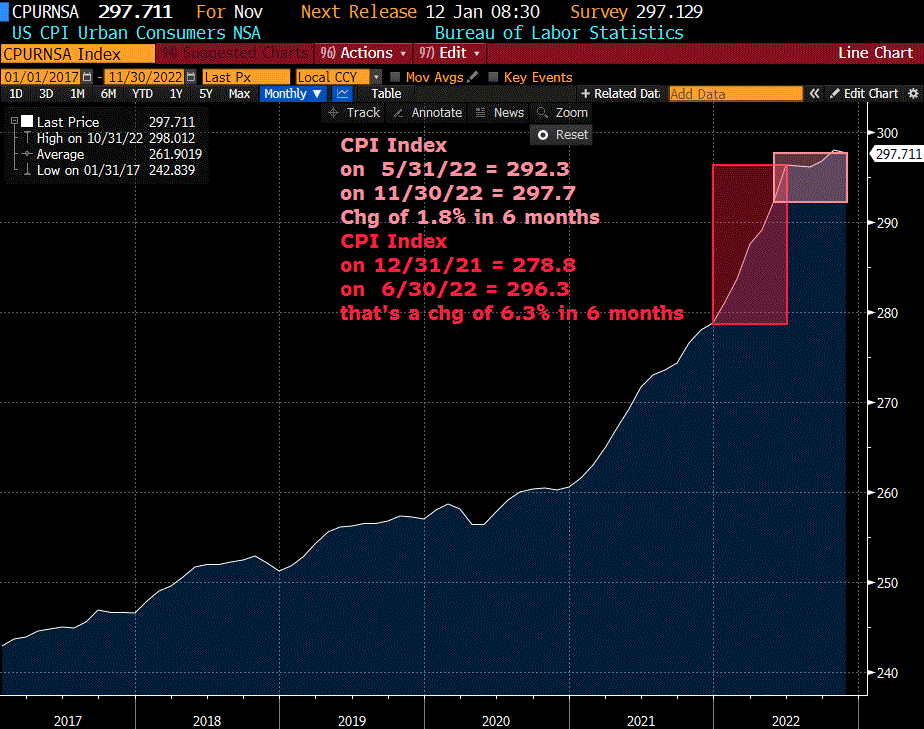
With respect to CPI, this chart clearly shows deceleration in the rate of advance. CPI Price index stopped going up in June. Any surprise that the market is pricing eases from June of next year?
| 12/23/2022 | 12/30/2022 | chg | ||
| UST 2Y | 428.0 | 440.3 | 12.3 | |
| UST 5Y | 386.0 | 397.0 | 11.0 | |
| UST 10Y | 374.3 | 384.0 | 9.7 | |
| UST 30Y | 382.0 | 393.3 | 11.3 | |
| GERM 2Y | 264.8 | 276.4 | 11.6 | |
| GERM 10Y | 240.3 | 257.1 | 16.8 | |
| JPN 30Y | 150.9 | 160.1 | 9.2 | |
| CHINA 10Y | 286.6 | 283.9 | -2.7 | |
| SOFR H3/H4 | -88.0 | -77.5 | 10.5 | |
| SOFR H4/H5 | -80.5 | -88.5 | -8.0 | |
| SOFR H5/H6 | -7.0 | -6.5 | 0.5 | |
| EUR | 106.17 | 107.03 | 0.86 | |
| CRUDE (CLG3) | 79.56 | 80.26 | 0.70 | |
| SPX | 3844.82 | 3839.50 | -5.32 | -0.1% |
| VIX | 20.87 | 21.67 | 0.80 | |

