Banquets
January 3, 2021
Sooner or later, we all sit down to a banquet of consequences. -Robert Lewis Stevenson
A crust eaten in peace is better than a banquet partaken in anxiety. -Aesop
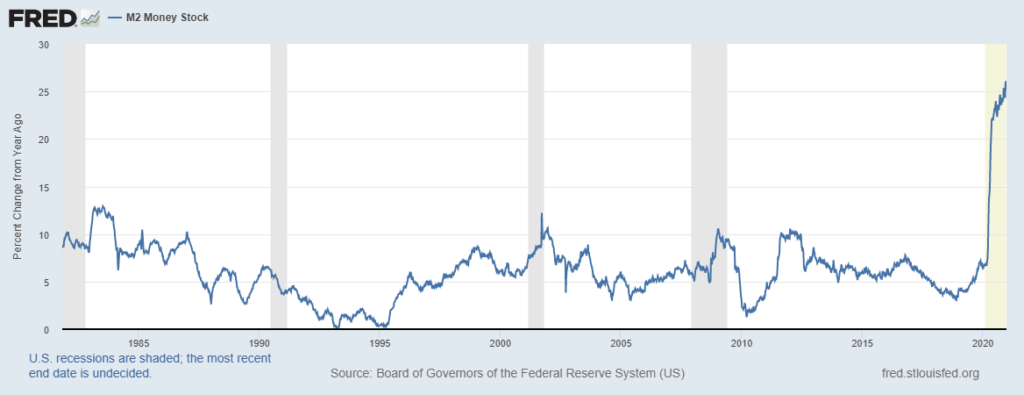
I’ve posted a graph of M2 growth before, and anyone reading this is familiar with the extraordinary stimulus from both fiscal and monetary policy in 2020. But this is still a stunning chart, with yoy growth in M2 at over 25%, more than double the previous high over the past forty years. That high was in 1983 at 12.6%. At that time, CPI was around 3.5%, down from a peak 14.7 in 1980. Unemployment was 8.5 to 9% down from a high of 10.7 in 1982. The ten year treasury yield was 10-11% down from a peak 15.8 in 1981. For that brief period the UST ten-yr provided a real yield somewhere around 7%. Now it’s negative 1%.
The question of course is, are we still in the process of setting the table for the ultimate banquet, or are we simply reaping the beneficial outcomes of soaring equity prices and low interest rates? I labor under the (now suspect) theorem that borrowing now, whether by government or the private sector, is pulling future economic activity forward. Here are a couple of market snippets for 2020: IPO issuance has nearly doubled from the old record. Blank-check SPACs have proliferated. From BBG: “At a time when headlines were dominated by a raging virus, recession, and the fastest ever bear market, a record $120 trillion of stock changed hands on US stock exchanges this year, up 50% from 2019 to a record.” From Q3 2019 to Q3 2020 Fed’l Govt debt rose 22% and Business debt rose 8.6%. Are there no consequences?
There’s a great scene in the animated film Ratatouille (thanks RL) where the famed and feared restaurant critic Anton Ego addresses his hapless waiter, saying, “…you know what I’m craving? A little perspective. That’s it! I’d like some fresh, clear, well-seasoned perspective. Can you suggest a good wine to go with that?” The flummoxed waiter hems and haws as Anton continues, “Perspective. Fresh out, I take it? Very well, since you’re all out of perspective and no one else seems to have it in this bloody town, I’ll make you a deal. You provide the food. I’ll provide the perspective, which would go nicely with a bottle of Cheval Blanc 1947.” He is, of course, served the peasant dish ratatouille, and on his first bite he’s magically transported back to childhood in his mother’s rustic kitchen…
These markets seem to have lost perspective. But the table of consequences is being set. Stocks are at record highs with pockets of rampant speculative excess. Gold has gained 25% this past year with silver up 47%. BBG Agricultural (BCOMAG) index is up 15% on the year, and up 40% off the mid-year low. The base metals spot index (CMDIBASS) is up 19% and 50% from the year’s low. From my viewpoint, commodities, agricultural and oil, appear relatively cheap in comparison with financial assets. Here’s the ratio of SPX to the BBG Commodity Index.
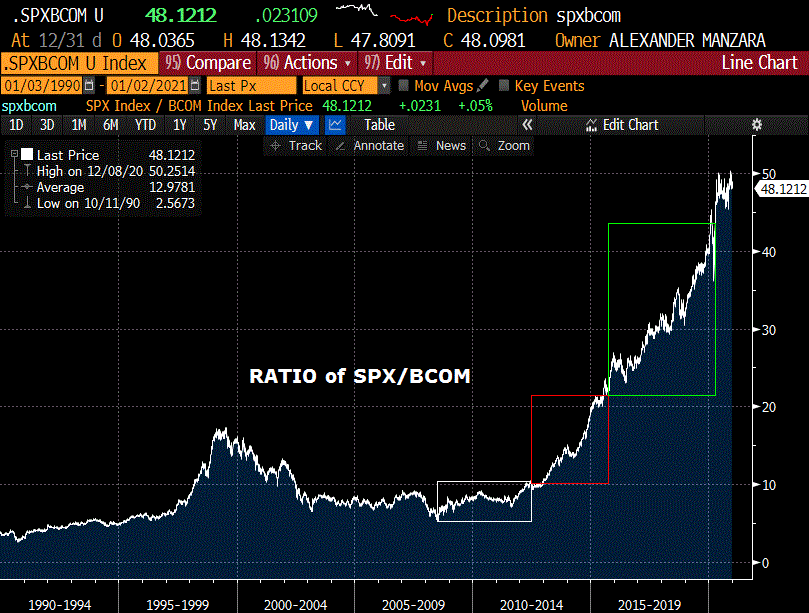
I have a rule of thumb about speculative excess. My disclaimer is that it’s probably not particularly useful. Strong trends double three times and then become very unstable. On my ratio chart above, it took about 4 years for the first double off the 2008 low. Then a bit over 3 years to double again, then 4 and a half years to double again. Of course, something like TSLA has done the triple-double (and more) just in the space of this year off the split-adjusted low of 70 in March. Nasdaq doubled three times off the 2008 low when it reached 8200 in 2019, and is going for 4x having ended the year at 12888.
A few years ago, the narrative regarding the Fed was that it was operating with three mandates: price stability and full employment (the original two) with financial stability completing the triad. The Richmond Fed released a paper in June 2017 with the rhetorical title, ‘Does the Fed Have a Financial Stability Mandate?’ It included this line: “The Financial Stability Oversight Council (FSOC) comes closest to an agency responsible for financial stability…formally charged with identifying risks… promoting market discipline by reducing the expectation of government bailouts… ” With respect to the Fed: “Despite relatively vague financial stability deliverables, it is very likely that lawmakers and financial market participants expect the Fed to take strong actions to achieve stability. This raises some potential problems that remain unresolved.” FSOC seems to have fallen a little flat with respect to reducing expectations of bailouts. Given the Fed’s new average inflation targeting, my view is that potential problems regarding financial stability will come to bear this year. As an addendum, the ten year treasury to tip breakeven spread ended the year just over 200 bps, the high since Q4 2018 when the FF target was 2.0-2.25%.
Georgia Senate elections on Tuesday. ISM Mfg also on Tuesday; Jobs report on Friday. Minutes of the Dec FOMC on Wednesday. Several Fed speakers through the week, the most important of which is likely Clarida on the economy and monetary policy on Friday.
OTHER MARKET THOUGHTS/ TRADES
I personally bought some Jan VIX 32.5 calls for 1.00 last week (not a recommendation). However, I’m not sure there’s enough time for this to play out. For example, a solid SPX rally in the last half of 2017 was followed by a 7% burst in January with the new tax package. The top was on January 26, followed by a rapid 11% drop. The difference now is that post-inauguration tax reform will be in the opposite direction.
Implied vol in treasuries firmed into the end of last week in front of this week’s news schedule. In tens, the 137 put remains the peak of open interest, signifying a strike just above the 1% yield level; cash tens closed the week at 91 bps vs TYH1 138-025. TYG 137p have 186k open, while TYH 137p have 76k. That mostly represents shorts against long 138’s on ratio trades. A win by Dems on Tuesday would likely cause a jump in yields, though Friday’s employment data should be a counterbalance, with NFP expected at just 50k.
There were a few trades Thursday protecting against a yield surge. 2EH 9925/100.25 risk reversal traded 0.25 covered 9975, bought put 50k. The put alone settled 0.25 vs 9974.5 in EDH23. 2EM 9950/9925ps bought for 2.5 20k. Settled 2.25 ref 9970.0 in EDM23.
| 12/24/2020 | 12/31/2020 | chg | ||
| UST 2Y | 12.7 | 11.9 | -0.8 | |
| UST 5Y | 38.2 | 35.8 | -2.4 | |
| UST 10Y | 93.3 | 91.0 | -2.3 | |
| UST 30Y | 167.1 | 164.0 | -3.1 | |
| GERM 2Y | -70.5 | -70.0 | 0.5 | |
| GERM 10Y | -54.8 | -56.9 | -2.1 | |
| JPN 30Y | 62.4 | 64.4 | 2.0 | |
| CHINA 10Y | 322.9 | 314.6 | -8.3 | |
| EURO$ H1/H2 | 2.0 | 1.0 | -1.0 | |
| EURO$ H2/H3 | 8.0 | 7.5 | -0.5 | |
| EURO$ H3/H4 | 30.0 | 28.5 | -1.5 | |
| EUR | 122.15 | 121.77 | -0.38 | |
| CRUDE (active) | 48.23 | 48.52 | 0.29 | |
| SPX | 3703.06 | 3756.07 | 53.01 | 1.4% |
| VIX | 21.53 | 22.75 | 1.22 | |
https://www.richmondfed.org/publications/research/economic_brief/2017/eb_17-06

