April 8. Employment and Inflation? Or Asset Prices?
Fed Chair Powell’s speech on Friday was a boilerplate discussion of the labor market, productivity, and inflation. Solid presentation, with a requisite number of charts. The basic message is that risks are balanced, while wages and inflation should continue to firm up. With respect to growth he noted, “The median of FOMC participants’ projections of this longer-run trend growth rate is 1.8 percent. The latest estimate from the Blue-Chip consensus of private forecasters is about 2 percent.” On the inflation front, he actually referred to the huge drop in mobile phone usage prices that had distorted CPI a year or so ago and noted that year-over-year comparisons would strengthen further as those effects drop off the calendar. (A google search for mobile phone usage prices and CPI gives several results from June 2017). The conclusion is, “…further gradual increases in the federal funds rate will best promote goals.”
What was omitted from the speech? There was nothing about ‘assets’ or ‘asset prices’, and nothing about libor (which both figure prominently in the economic outlook). Brainard’s speech earlier in the week deemed asset prices as “elevated’. Bostic said the Fed doesn’t currently view market volatility as a problem. Bullard doubled down on his prediction of last December, noting that curve inversion later this year remains a possibility. He added, “I should be TRADING this stuff!” No, he didn’t really say that, but perhaps he was thinking it, like many prognosticators that latch onto their one-in-ten accurate calls as overwhelming evidence of superior models.
The point is, the current model is complicated, financially, politically, and internationally. I have been thinking about weakness the dollar as it relates to equity prices, and to the price of crude oil and other commodities. Many have wondered why the dollar hasn’t firmed given wide rate differentials and a Fed that appears intent on a course of tightening. Last week I highlighted recent correlation between the flattening curve and the lockstep decline in DXY. This week I have been thinking about net treasury issuance as a proxy for an increase in supply of USD. Though that particular theory may have zero validity, I found it interesting to glean some information from TBAC (the Treasury Borrowing Advisory Committee). For example, in Q1, the Treasury raised $440B in new net cash (this at a time when the Fed’s QT is at a supposed rate of $20b per month). In Q2 net issuance is estimated at another $192 billion (with QT at $30b/month). These are big numbers. The Q1 2018 Treasury presentation is also interesting in terms of the chasm between Primary Dealer estimates of the Federal Deficit vs the CBO and OMB. For 2018, 2019 and 2020, Primary Dealers estimate $750b, $965 and $1025. CBO estimates run at 2/3 to 3/4 of those amounts, and OMB fancifully runs at about half, projecting a deficit of only $488b in 2020.
In any event, we have a situation where the Fed is content to continue tightening, the treasury is on a borrowing spree, and asset prices hang in the balance. Stocks are not taking kindly to Trump’s tariffs and his attacks on big tech. He admitted we may ‘take a hit’. The combination of former Fed encouragement for companies to issue debt for stock buybacks along with the current potential for ‘crowding out’ due to treasury borrowing is of looming concern. These factors have negative connotations for both the curve and the dollar. Indeed, the curve remains pegged to the lowest levels since the crisis years of 2007/2008. JPM notes inversion in the forward OIS curve. I have previously mentioned the inversion in EDZ0/EDH1 at -0.5, and on Friday, as the April serial Eurodollar is set to expire in one week, the April/June Eurodollar spread closed at -1.0 (J8 9767.0 and M8 9768.0). Flight-to-quality impulses are muffled by both the Fed’s stance and upcoming treasury supply.
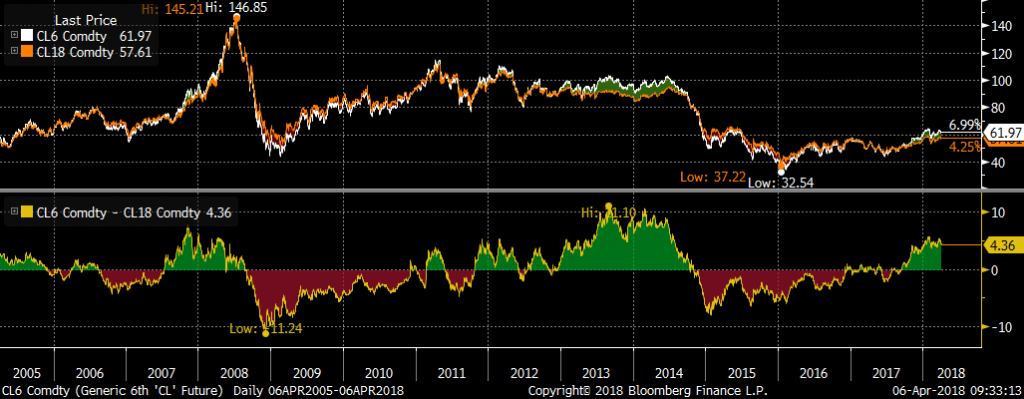
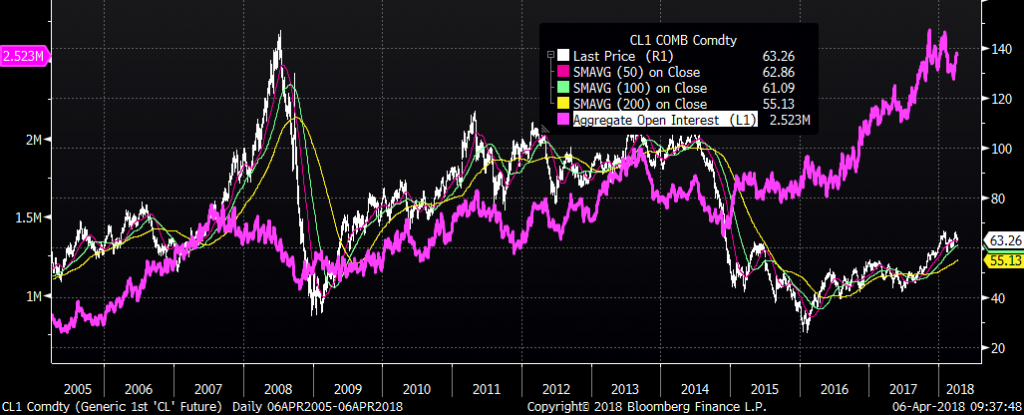
Let’s suppose for a moment that a somewhat slower pace of treasury borrowing in Q2, along with higher inflation readings that support Fed hikes, conspire to boost the value of the dollar. What happens to commodity prices? Arguably the most important commodity in the world is oil, notwithstanding mobile phones. Below are a few charts relating to WTI.
The top chart is the rolling price of the front CL contract in white, along with aggregate open interest showing 2.5 million contracts in violet. The second chart shows the spread between the forward 6th to 18th contract. Note that nearer contracts trade at a premium (denoted by green areas), just as they did prior to large plunges in 2008 and 2014.
 The final chart, shows the Commitment of Traders (COT) record net speculative long position of over 700,000 contracts. Again, this chart shows an interim high in 2014, just before oil took a tumble. Friend and energy expert JJ notes that commercial shorts are embedded in credit deals, the implication being that IF prices fall, these shorts will not provide a bid as they’re locked into positions. I do not have any special insight into the energy markets; I assume that Saudi Arabia and Russia both have strong incentives to keep oil prices high, and that the new petro-yuan trading in China is another factor that perhaps leads to a softening USD. My only point here is that IF the dollar were to firm, and IF that were to lead to a lower USD price of oil, an unwind of the record long spec positions could magnify losses at a time when huge open interest provides tinder for the conflagration.
The broader point is that a rally in the dollar could easily translate into lower asset prices, upon which the US economy has become dependent.
One last thought concerns the idea that China might sell US treasury holdings as a response to tariffs and other trade restrictions. The NY Fed chief-to-be, John Williams, trotted out the standard line, that China would do itself great harm if it chose that course (from Reuters). I think, to paraphrase Mark Zuckerberg, that response is “glib”. According to the FSB, about 50% of “the world’s riskier non-bank loans are held in China. Linked to the supply of credit, these loans could pose ‘systemic risk’ “. China has been taking hard steps to decrease financial excesses, including the takeover of Anbang. This week HNA disclosed it was trying to sell its stake in Hilton in an effort to escape crushing debt. While Trump warned the US might take a hit with regard to trade measures, China appears quite willing to take short term pain in pursuit of long term goals. This week’s US Treasury auctions of 3’s, 10’s and 30’s beginning on Tuesday may be more important than usual.
Week ahead: On Tuesday PPI is expected +0.1 Core +0.2. NFIB is also out…watch this one, it’s been correlated with Russell so a large decline would be a worrisome signal. On Wednesday CPI expected 0.0, yoy 2.4, and Core 2.0 from 1.8 (!!!). FOMC minutes on Wednesday. FB’s CEO Zuckerberg testifies to Congress Wednesday, which can only be disastrous. Auctions: 3, 10, 30 start Tuesday.


