April 22, 2018. Pressure and Time
Geology is the study of pressure and time. That’s all it takes, really. Pressure…and time.
–Ellis Boyd ‘Red’ Redding (Shawshank Redemption)

Might paraphrase that and say inflation is the product of pressure and time. That’s all it takes. I’m not quite sure that’s all it takes, but it does seem as if all the concern about not being able to reach the inflation target is in the rearview mirror. Even Kashkari said, “I think it’s likely that fiscal actions that have been taken are going to on the margin help us achieve our inflation target.” Other Fed officials are saying there isn’t likely to be an inflation ‘breakout’, as if they’re harboring concerns of an overshoot.
There are often commentaries that say rates CAN’T go up because there’s no wage growth, and that the economy can’t possibly withstand higher rates due to over-indebtedness. The underlying premise seems to be that a boom/bust cycle has simply gone by the wayside. As the President likes to say, “We’ll see.”
For now I am simply going to post a few charts that I find interesting, and attempt to weave some stories together. The first chart features a couple of ‘market based’ inflation measures, the ten year tip breakeven rate and the 5y 5y forward inflation swap. Both have been generally increasing since the middle of last year. As previously mentioned, I don’t put much faith in the tip breakeven, however, other inflation price measures are also increasing, including the NY Fed’s UIG (Underlying Inflation Gauge), which is last at 3.14 for the ‘full data set’ and at 2.23% for the ‘prices-only’ measure.

The next chart is of a slightly longer time-frame, going back to 2012. This chart overlays the ten year treasury yield, which hit a new high this week of 2.96%, with the red/gold (2nd year to 5th year) Eurodollar pack spread. What is interesting about this chart is that in 2013, when the taper tantrum occurred, these two measures traded in lock step. Both topped right around 3% at the end of 2013. Since then however, with the exception of the post-election spurt, red/gold has declined, having posted a new low last week of 8.25 bps, just under the previous tightening cycle low (10.25 in ’06). It’s quite a change, though easily explained away. In 2013 the fear was a massive withdrawal of Fed bond buying, not the idea of constant Fed Fund tightening. Now, Fed hikes have flattened the curve and caused general rate rises, while increased government supply is starting to seep into the market’s consciousness. But this chart still displays a fairly large dislocation, and as I showed a couple of weeks ago, the flattening curve this year has been associated with a weaker US dollar. Eventually, yield differentials will cause dollar shorts to pare back positions, and comments by both Carney and Draghi tempered the idea of more restrictive (relative) policy, with Draghi saying “Notwithstanding the latest economic indicators, which suggest that the growth cycle may have peaked, the growth momentum is expected to continue.” Not exactly brimming with confidence, and the euro closed near the low of the past three month’s range.

I would further note that the market is pricing near term Fed hikes fairly aggressively already, with a June hike at over 90% (July Fed Funds are 98.085 or 1.915% vs current Fed Effective of 1.69, a spread of 22.5). Aug/Oct FF spread isolates odds of a September FOMC hike; that spread is 17.5/18.0, which represents over 70% chance of a move at that meeting. And November/January FF spread is 11.0/11.5, putting December near 50/50. On top of that, there was a buyer of 100k EDH9 9675p Friday for 1.5, suggesting risk of an even steeper hike trajectory.
So if near term contracts are making new (price) lows, and longer term yields are making new highs at the same time, then flattening may have run its course. Indeed, the end of the week featured a solid bounce in the curve. Further, 2 and 5 year notes are nearing technical resistance at 50% retracement levels from the 2007 highs to 2012/13 lows. In the 2y, the high was 5.10% and low 15 bps, so 50% is 2.625 vs current 2.455% (w/i 2.475) and the 5y high/low is 5.206% to 54 bps so halfway is ~2.87% vs current 2.795%. Longer dated contracts have room to run with 50% in tens at 3.33% vs current 2.96.
The next chart is one I trot out every so often, SPX priced in terms of commodities. I use SPX divided by the Bloomberg Commodity Index. For a long time, financial assets have been favored over ‘things’. Now, a four-year long upward sloping trend line has broken, was re-tested, and the price is near the low of 2018.

Most commodity indexes are heavily weighted with oil, and BCOM is no different, though the energy component dropped slightly in 2018 to 30.57%. Oil prices continue to rise, but I would also note that precious and industrial metals comprise over 33% of the index, and cite this from the Credit Bubble Bulletin: “Silver rose 3.0% this week, with Palladium up 4.2%, Aluminum 8.1%, Zinc 3.7%, Nickel 6.4%, Tin 3.2% and Copper 2.8%.” Some of these price increases are related to Mideast tensions, some to trade tensions. How much pushes through to inflation? Not sure, but both Gundlach and Gross have talked about favoring commodities as a late cycle play, and this chart captures that sentiment, favoring commodities over tech stocks.
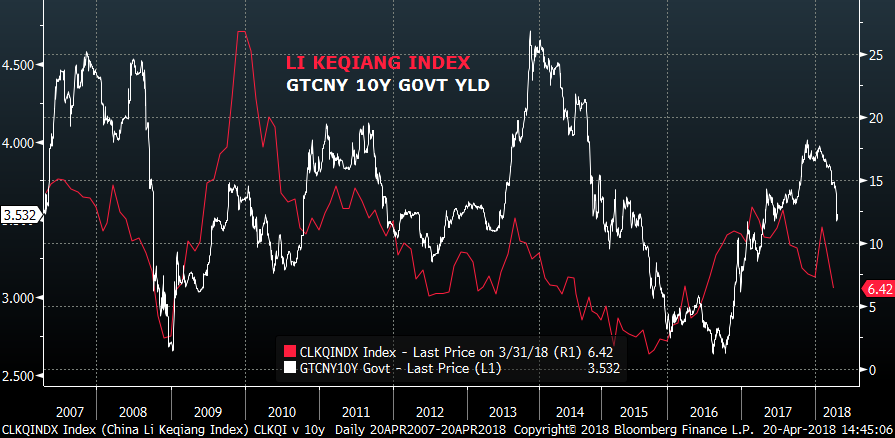
The last topic is China, which is further in the news this weekend as Treasury Secretary Mnuchin floated the idea of a visit to smooth trade tensions. It’s likely that such a trip would result in the Trump administration being able to victoriously claim concessions, and perhaps stocks will bounce at the start of the week in a vote of confidence. However, larger concerns for China are probably centered on military control of the South Sea (grant a few trade benefits in exchange for non-interference), and its own domestic economy and debt imbalances. Last week the PBOC cut RRR by 100 bps. The chart below shows the Li Keqiang Index at a 2 year low, and a near 50 bp decline in the ten year government yield from 4% to 3.52%. China forecasts growth of 6.5%, but these indicators suggest that target may be hard to hit. One might also conclude that China’s support for the US treasury market may erode further.
From Wikipedia: Li Keqiang (then the Party Committee Secretary of Liaoning) told a US ambassador in 2007 that the GDP figures in Liaoning were unreliable and that he himself used three other indicators: the railway cargo volume, electricity consumption and loans disbursed by banks.
In summary, US inflation, sparked by the weaker dollar and Trump policies, will likely retain forward inertia. Although relative rate perceptions should cause stabilization or an outright rally in the dollar, commodities will still outperform stocks. The front end of the US curve has been significantly priced for rate increases; weakness in the long end is likely to become the focus.
This week features auctions of 2, 5 and 7 year notes starting Tuesday.
We’ll get Q1 advance GDP on Friday. Atlanta Fed’s GDPNow stands at 2.0 and NY Fed’s Nowcast at 2.91%.
| 4/13/2018 | 4/20/2018 | chg | |
| UST 2Y | 236.1 | 245.3 | 9.2 |
| UST 5Y | 266.7 | 279.0 | 12.3 |
| UST 10Y | 282.1 | 294.7 | 12.6 |
| UST 30Y | 302.5 | 313.8 | 11.3 |
| GERM 2Y | -58.2 | -56.1 | 2.1 |
| GERM 10Y | 51.1 | 59.1 | 8.0 |
| JPN 30Y | 69.3 | 73.1 | 3.8 |
| EURO$ Z8/Z9 | 30.0 | 34.0 | 4.0 |
| EURO$ Z9/Z0 | 4.5 | 7.0 | 2.5 |
| EUR | 123.31 | 122.89 | -0.42 |
| CRUDE (1st cont) | 67.39 | 68.40 | 1.01 |
| SPX | 2656.30 | 2670.14 | 13.84 |
| VIX | 17.41 | 16.88 | -0.53 |

