April 15, 2018. The tipping point
A lot of economic theory is concerned with what happens at the margin. How do we determine ‘the tipping point’, the time when critical mass sparks a change?
I saw a headline ‘Boeing shares slide after Russia threatens to halt titanium sales’. I’m not sure if that particular story correctly pegged the price action, but Boeing was down 2.4% Friday, when both Nasdaq and SPX were down around 0.5%. I started to think about how much the modern world takes the idea of ‘availability’ for granted. Some things simply aren’t in endless supply (except for treasury bonds). Below are a couple of charts associated with electric vehicle batteries, lithium and cobalt, which both hit the tipping point around two years ago. Cobalt has gone from 25000 to 92000 over the last two years, and Lithium from 100 to 290 in the past 2.5 years. Apparently, about half of the world’s cobalt comes from the Democratic Republic of Congo, which has a bad record concerning child labor in the mines. Like everything else, there’s a touch of grey that seeps into every green story.

These prices on their own don’t have a lot to do with global interest rates. As the market ‘works’ we expect higher prices to encourage new supply and alternative technologies. However, aluminum also surged in the past week. And of course, crude oil ran up to a new high, and probably has more to go given events in the Mideast. Last week I mentioned the record net spec long in oil. Sometimes, the crowd is right.
The week ended with a bang, as the US, France and UK launched strikes on Syria’s chemical plant facilities. Whether this operation provokes unimagined consequences remains to be seen. I suppose the ‘Mission accomplished’ tweet could be taken as a signal to the Russians of one and done. I view this attack as a serious escalation, coming at a time when global trade tensions are on high alert, and divisions within the US government are on daily display. If there were ever fears of breaks in the supply chain that can spark price dislocations, the ingredients are all here.
The markets had closed prior to the Syrian bombings. Often it’s hard to get a handle on all of the news and idiosyncrasies that occur in a given week, especially now. But interest rates are telegraphing some pretty clear signals. The curve closed out the week at new lows, perhaps helped along by Rosengren repeating that the Fed may have to be more aggressive than expected due to tight labor markets.
The 2/10 treasury spread (at futures settlement) closed at 46 bps, and 5/30 at 35.8, both new lows. More stunning was red to gold Eurodollar pack spread, which settled 10.875 (-4.875 on week), essentially at the low of the 2006 hiking cycle. Newsflash to Mr Rosengren, the curve is NOT telling us the economy is about to run ‘hot’. Swipe left, this is pretty much the opposite of hot. There’s no inflation premium, there’s no curve. There’s no fear (for now) that the tsunami of treasury issuance will lead to higher rates as these sales are absorbed by …by who? The market is acting as if Central Bank buyers are ready to climb back in. That’s not to say that inflation won’t accelerate; every passing day brings the probability of an inflation overshoot closer. It just might be in the context of general economic malaise made worse by the continuous rise in dollar funding costs represented by libor. EDM8 settled 9762.0 or 2.38%, 2 bps above the US 2Y treasury yield of 2.36%. (Thanks YZ).
I recall listening to a competitor’s sales pitch a long time ago, Andy Tottman, who earnestly asked the client, “Wouldn’t you like to own bonds at 5.50%?” (The yield at the time was below that level) and he continued, “Just sell these puts. If the market gets down there you’ll own bonds at that yield!” Anyway, that advice echoed this week, and someone thought it would be a good idea to launch 12k USU 143 puts at a premium of 1’21 as USU was trading around 145-18 on Wednesday. Call it 2 1/2 points out of the money or maybe 13.5 bps, and additional premium of 7 bps, as the current 30 year bond yield was just over 3%. What prompts a cheap (vol under 7%) sale in a maturity that has no open interest? “HEY, maybe I can lock in 3.25% yield on US 30’s!” Or maybe it’s just this: Yields cannot go up. Premium should be sold. The Fed’s going to kill the economy. By the way, the 30 year JGB sank this week to a new low just under 70 bps, lowest in 1.25 years.
Below is a long term chart of the 30 year bond yield.

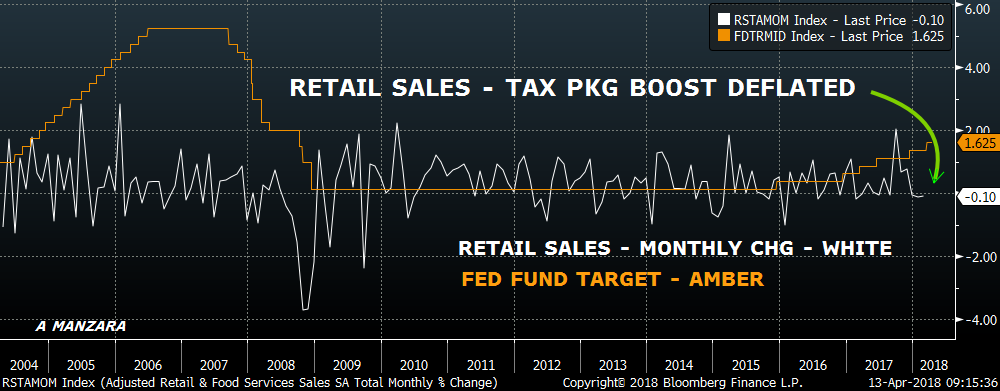
One last chart regarding economic data. Retail Sales are out on Monday, and recent numbers have indicated deceleration, in part due to a pay back after fall hurricane-induced spending. Here’s a chart of retail sales, which doesn’t look particularly robust.
The upcoming elections may also have bearing on the markets, as midterms portend damage to the Trump financial revolution. Here are links which indicate odds of Democrat/Republican control of the House and Senate. Currently, approx. 70% chance of Dems controlling House and 63% chance of Reps retaining Senate.
https://www.predictit.org/Market/2704/Which-party-will-control-the-House-after-2018-midterms
https://www.predictit.org/Market/2704/Which-party-will-control-the-House-after-2018-midterms
Week ahead: Chock full of Fed speakers. Bostic on Monday, (1:15 with Q&A). On Tuesday Williams at 9:15 then Quarles at 10:00 (semi-annual testimony at House Financial Services Committee), and then Harker at 11:00. Dudley on Wednesday at 3:15 (with Q&A). Mester on Thursday evening at 6:45, and then Evans at 9:40 on Friday, followed by John Williams to wrap up the week at 11;15 (Fireside chat at Berkeley).
Economic events include Retail Sales on Monday, Housing Starts and Industrial Production Tuesday, Beige Book Wednesday, Philly Fed and Leaders on Thursday.
OTHER MARKET THOUGHTS/ TRADES
Typically the curve steepens when the Fed is done hiking and the market anticipates eases. The Fed narrative may begin to change, but it probably won’t be this week. More hikes means flatter. The synthetic steepener I highlighted this week. even though it wasn’t that big, was the 0EZ/2EZ 9725 call calendar, where paper bought the Short Dec on EDZ9 and sold the Green Dec on EDZ0 at 0.25 credit and then flat premium. At the time, the futures spread EDZ9/EDZ0 was 6.5. That spread settled at a new low of 4.5. The calls settled 13.5 ref 9711 in EDZ9 and 14.5 in 2EZ 9725c vs 9706.5; a small loss from entry. Another trade of the same ilk was done about a month ago: +45k 0EZ 9750c vs -30k 3EZ 9725c at a credit of 4.0 to 4.5 in middle of March. Prices were 9.75 and 16.75 so 29.25 (3x) vs 33.5 (2x). On Friday these settles were 7.75 (x3 is 23.25) and 14.5 (29.0), ref 9711 and 9705.5. Not particularly painful, but not exactly how it was SUPPOSED to unfold. The point here is that a stubborn Fed causes the back end to rally if, for example, asset prices fall. I have been recommending call spreads on blues and greens. Anything that causes an unwind of trades like those mentioned above will support the back end.
| 4/6/2018 | 4/13/2018 | chg | |
| UST 2Y | 226.6 | 236.1 | 9.5 |
| UST 5Y | 258.2 | 266.7 | 8.5 |
| UST 10Y | 277.5 | 282.1 | 4.6 |
| UST 30Y | 302.0 | 302.5 | 0.5 |
| GERM 2Y | -58.8 | -58.2 | 0.6 |
| GERM 10Y | 49.7 | 51.1 | 1.4 |
| JPN 30Y | 73.8 | 69.3 | -4.5 |
| EURO$ Z8/Z9 | 29.5 | 30.0 | 0.5 |
| EURO$ Z9/Z0 | 6.0 | 4.5 | -1.5 |
| EUR | 122.83 | 123.31 | 0.48 |
| CRUDE (1st cont) | 62.06 | 67.39 | 5.33 |
| SPX | 2604.47 | 2656.30 | 51.83 |
| VIX | 21.49 | 17.41 | -4.08 |
_______________________________________________________________________

