April 1. Flatter curve weighs on USD
Taking a look at some longer time frame themes this week, in part relating to inflation. This note will appear longer than usual due to the addition of several charts.
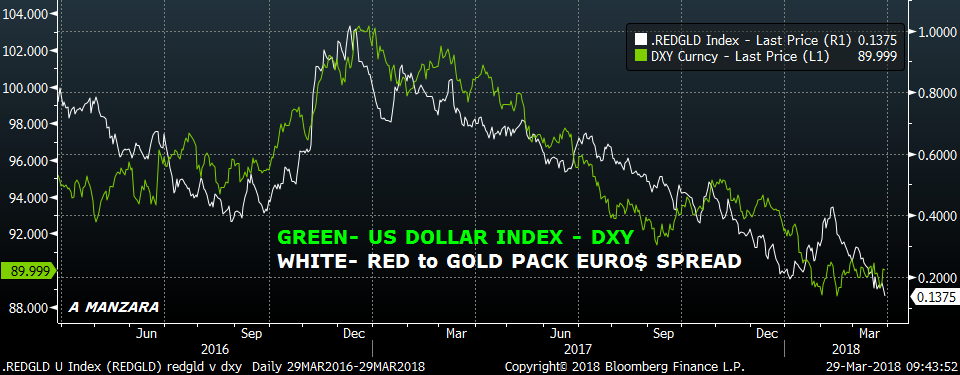
At least part of the discussion concerns the value of the dollar, which in turn is at least partially related to interest rates. I lead off with a couple series plotted over different time frames: the dollar index vs the Eurodollar red to gold pack spread. The red/gold pack spread is the 2nd year to 5th year forward on the euro$ curve, which correlates to 2/10 or 5/30 (a chart below will show all of these together). There have been many head-scratching articles noting that the dollar has weakened in spite of widening rate differentials, especially between European and US rates. In fact, this week the bund to ten year UST spread reached 232 bps before closing at 225, the widest it has been since late 2016. We all know that correlation is not causation, but it certainly appears as if movement in the curve has a strong relation to DXY on the chart below. There are a couple of things to note. First, the election in 2016 caused a surge in the curve and in DXY, with Trump’s promise to unfurl his version of protectionist deregulated capitalism. (I know it doesn’t make sense, but what does?) The next largest pop in the curve was at the beginning of this year, as the promise was fulfilled with the tax package. Fairly muted response to the actual policy implementation. Ultimately, DXY never really bought into the tax package, perhaps due to tariffs, and this week the curve made new lows.
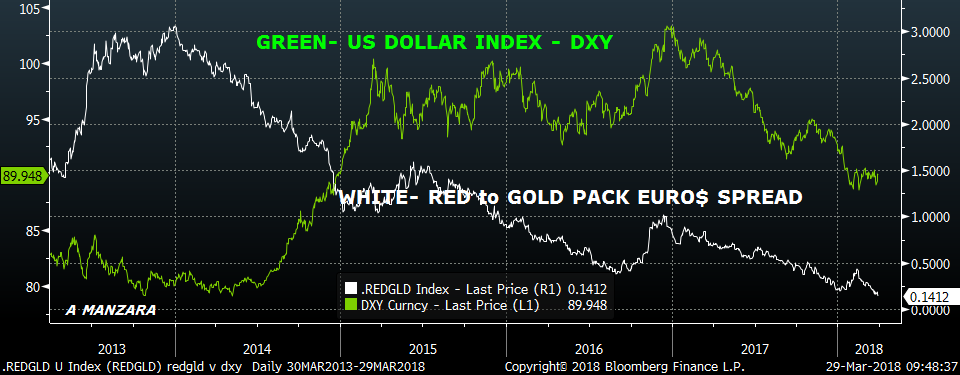
Now let’s consider the same chart over a longer time frame. Over five years, the curve and DXY have little correlation. After the curve (and ten year yields) posted their highs following the mid-2013 taper-tantrum, a flattening trend unfolded. But by mid 2014 the dollar began a surge higher as Abe’s yen depreciation was in full swing and the ECB’s QE program was anticipated. US growth was strong in 2014, with GDP hitting 5.2% in Q3/14.
Eventually, weakness in the currencies of US trading partners elicited a response by China, with devaluation in August 2015, sparking renewed fears of deflation due to the price cut on Chinese manufactured goods.
So where are we now? This week, the red/gold pack spread, as shown below, closed at a new low of 13.5, within a few bps of the low set in 2006, near the end of the last hiking cycle. While the treasury curve is well above previous lows, both 2/10 and 5/30 also made new lows this week at 47.3 and 40.7. This is late stage economic cycle stuff. We know how it ended in 2007/2008.
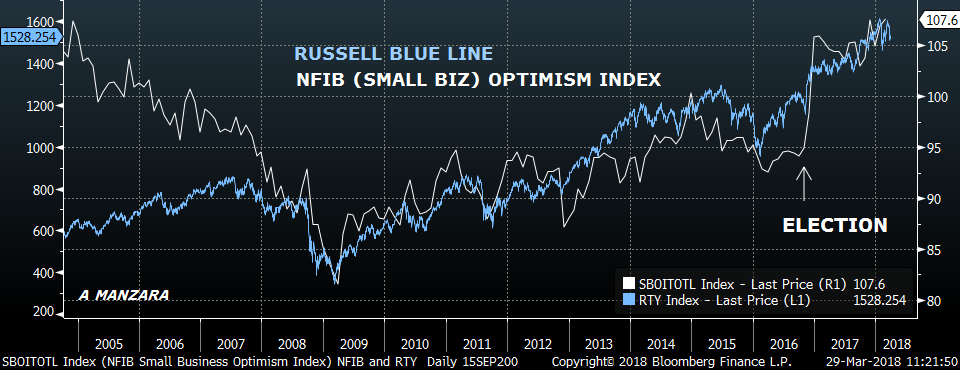
However, one might say that technical factors are at play, which distort economic signals, and therefore it’s incorrect to conclude that growth will slow. In fact, that’s what Powell DOES say, and there’s some evidence that supports that claim. For example, consider the next chart, which plots NFIB small business optimism vs the Russell 2000 small cap index. It’s clear that small business optimism was declining from 2005 on, in anticipation of larger problems ahead. The curve was flattening then, too. However, in the current period, optimism is clinging to fairly high levels despite a bit of shakiness on the equity front.
The other factor to note is that inflation appears to have gotten a foothold, with for example, the NY Fed’s UIFG (Underlying Inflation Gauge) posting a new high above 3%, and the Fed’s preferred measure of PCE prices printing respectable rates of +1.8% with Core +1.6.
Additionally, CNY is essentially back to where it was before the devaluation (Aug 2015), as the next chart shows. (Some analysts look at the spread between off-shore and domestic yuan to determine stress, as was evident in the latter part of 2015. I’ve included both on the chart below). While the yuan has strengthened relative to the dollar, it has been steady vs the euro for the past year. It’s the dollar that’s weak, and a weaker dollar eventually feeds into a bump in inflation.
In fact, if the powers that be decided that the best policy response to relieve the burden of crushing debts and pension obligations were to weaken the dollar and try to inflate away debts, they’re doing a pretty good job. How to ensure a weaker currency? 1) Lift rates gradually, being careful not to actually tighten conditions too much 2) increase the trajectory of treasury issuance 3) impose tariffs 4) attack the technology companies that have been driving wages and prices lower. The problem of course, is that the ‘wealth effect’ can shift into reverse, creating a headwind to growth, and possibly resulting in stagflation.
News this week includes
Monday: Mfg ISM expected 60 vs 60.8.
Tuesday: 4:30 NY Time, Lael Brainard speech on Financial Stability
Wednesday: Non-Mfg ISM expected 59 from 59.5, along with ADP.
Friday: Employment Report, with NFP 189k.
**Powell also speaks on Friday at the Economic Club of Chicago on the Economic Outlook
_______________________________________________________
| 3/23/2018 | 3/29/2018 | chg | |
| UST 2Y | 228.7 | 227.0 | -1.7 |
| UST 5Y | 261.5 | 256.4 | -5.1 |
| UST 10Y | 282.3 | 274.3 | -8.0 |
| UST 30Y | 306.9 | 297.1 | -9.8 |
| GERM 2Y | -61.1 | -60.2 | 0.9 |
| GERM 10Y | 52.7 | 49.7 | -3.0 |
| JPN 30Y | 73.6 | 73.8 | 0.2 |
| EURO$ Z8/Z9 | 32.5 | 29.0 | -3.5 |
| EURO$ Z9/Z0 | 7.5 | 5.0 | -2.5 |
| EUR | 123.56 | 123.23 | -0.33 |
| CRUDE (1st cont) | 65.88 | 64.94 | -0.94 |
| SPX | 2588.26 | 2640.87 | 52.61 |
| VIX | 24.87 | 19.97 | -4.90 |


