A soothsayer bids you beware the ides of March
15-March 2020, Weekly comment
Now let it work. Mischief, thou art afoot,
Take thou what course thou wilt! -Mark Antony

I just couldn’t help myself in using Julius Caesar in this week’s note as markets have endured three and thirty wounds in the past week. I know, not particularly original. While stocks staged a spirited rally on Friday afternoon, underlying dislocations and injustices are continuing, one after another. I am just going to mention a few of them. People far more knowledgeable than me are writing about the intricacies, so I am only providing a couple of charts below. My overwhelming thought is that there is a lot to play out, and it’s going to get much worse from a liquidity standpoint.
The magnitude of the recent move has been breathtaking with SPX down 27% from high to low in just three weeks. On a closing basis, SPX was -8.8% this week. Treasuries had their largest weekly ranges ever. Ten year yield jumped 24 bps on the week to 0.946% and thirties 35 bps to 1.557%. The two year was down 1 bp, so 2/30 spread gained 36 to 108 bps. Every government and central bank is trying to mitigate the fallout of COVID19. “Whatever it takes… And believe me, it will be enough.” The Fed announced massive $1.5T term repos on Thursday, with the FOMC meeting this Wednesday. Fed fund futures are essentially projecting a cut to zero, with the April contract closing at 99.84 or 16 bps, vs current Fed Effective of 1.09% to 1.10%. One year out, FFJ21 closed at almost the same price, 99.845. I am not saying it’s correct, but the FF market is currently implying that the Fed will be at zero for a year. However, there is a lot more turmoil in the euro$ curve. April ED FELL 15 bps on Friday as credit and funding concerns gripped the market. The week to week change in EDJ0 was actually up 8 bps in price to 99.28, but the week to week change in FFJ0 was +35 bps, from 99.49 to 99.84. The forward one-year calendars in dollars all made new recent highs. For example, EDH21/EDH22 settled 25.5, up 16 from the previous Friday. At the end of February all near one-yr ED calendars were significantly negative, now they are all positive save the front EDM0/EDM1 at -3.5 from a recent low of -30.5 on Feb 25.
The front June EDM0 contract is reflecting funding concerns. While spreads have blown out, most are nowhere near levels seen in the 2008/2009 crisis. For example, when the market perceived Fed cuts in 2007, (albeit from a much higher initial FF rate) the red/gold ED pack spread surged from 25 in 2007 to 225 in early 2008. Ultimately, the spread topped at 300. Currently, red/gold pack spread has moved from a bit over zero in 2019 to its current level over 55. This week it gained 35 bps. Corporate bond spreads have jumped, but again, nowhere near 2008 when BBB spread nearly hit 800 bps. St Louis Fed’s site has the BBB option-adjusted spread at 277 bps, around the high of the EM/energy blow-up of 2016. As a rough proxy of libor/ois I look at a rolling spread of the 2nd ED quarterly to the 5th FF. The spread has currently surged from just above zero to 39 bps, around where it reached in last year’s mid-Sept repo ‘crisis’. In 2008 it reached 150 bps. Of course, bank shares have collapsed with some of the larger European banks, DB and CS for example, making all-time lows.

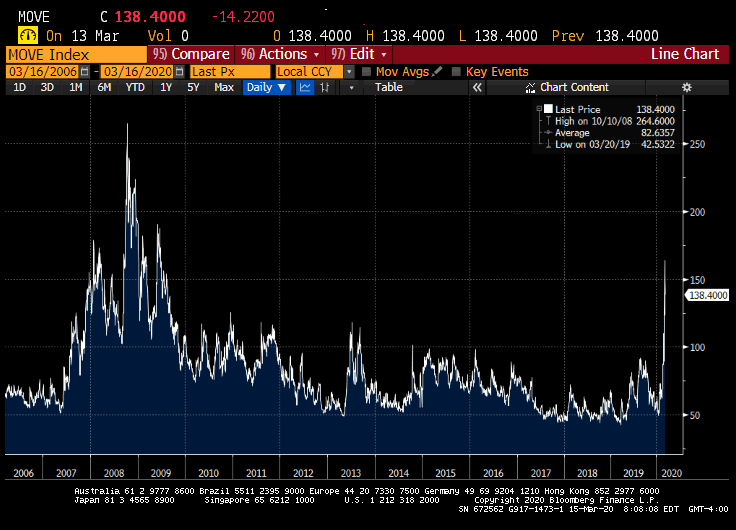
The VIX has, of course, surged, hitting a high of 77 but not quite reaching the crisis high of near 90. The MOVE index (above) is 163, about the same magnitude of gain as it had in late 2007, when it then fell back to 100, before it surged to its ultimate high in late 2008 of 264. (MOVE is weighted index of 1-month normalized vol over the treasury curve).
One area where spreads did exceed highs in 2008 is munis. The VanEck high yield muni ETF experienced its biggest drop ever. Of course, the markets did not take kindly to Lagarde saying it was not the central bank’s job to close spreads. Tough love may have worked in the old job Christine, but not in this one.
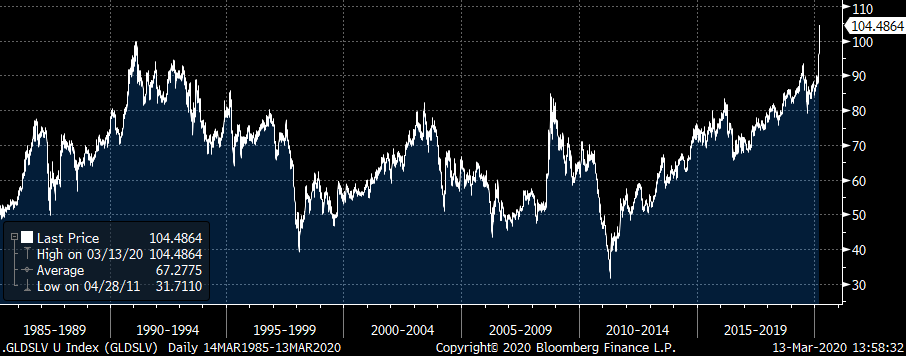
The below chart is gold/silver ratio, at an all-time high, and that’s with GCJ0 having plunged 9.3% this week.

I have a friend from CME floor days, who in the old vernacular, says there’s no one standing in there to keep this stuff in line. He means euro$ spreads and butterflies, and he’s referring to the screens, even though in the old days we would have meant big market makers standing in the pit. All I can say is, the liquidity is drying up; the old boundaries don’t necessarily have to hold.
A trade, sir, that, I hope, I may use with a safe
conscience; which is, indeed,
sir, a mender of bad soles. -Cobbler answering Marullus with a
homophone (soles/souls)
In the bigger picture, government budgets are going to explode. Central banks will be pressured to monetize debt and eventually reconsider the ‘trillion dollar platinum coin’ solution.
| 3/6/2020 | 3/13/2020 | chg | ||
| UST 2Y | 48.8 | 48.0 | -0.8 | |
| UST 5Y | 55.9 | 70.6 | 14.7 | |
| UST 10Y | 70.3 | 94.6 | 24.3 | |
| UST 30Y | 120.4 | 155.7 | 35.3 | |
| GERM 2Y | -85.8 | -87.0 | -1.2 | |
| GERM 10Y | -71.0 | -54.4 | 16.6 | |
| JPN 30Y | 31.1 | 32.7 | 1.6 | |
| EURO$ M0/M1 | -8.5 | -3.5 | 5.0 | |
| EURO$ M1/M2 | 10.5 | 26.0 | 15.5 | |
| EUR | 112.86 | 111.04 | -1.82 | |
| CRUDE (1st cont) | 41.28 | 31.73 | -9.55 | |
| SPX | 2972.37 | 2711.02 | -261.35 | -8.8% |
| VIX | 41.94 | 57.83 | 15.89 | |
http://shakespeare.mit.edu/julius_caesar/full.html

