What’s it going to look like in 2025?
April 28. 2024 – Weekly Comment
************************************
In the past week or so I saw two articles referencing potential moves by a new Trump administration that would impact financial markets.
This one’s from the Wall Street Journal a few days ago:

And this one is from Politico on April 15

There was also an interesting article on Politico about Susie Wiles. I had never heard of her, but she is apparently one of Trump’s closest advisors and a master at using her massive trove of press connections to keep campaigns on message and shape the narrative.
https://www.politico.com/news/magazine/2024/04/26/susie-wiles-trump-desantis-profile-00149654
It’s not that I believe press headlines; these days I don’t believe anything unless it hits the pnl. However, if you were charged with running a campaign to juice the price of gold, these would be valuable press insertions. Equally helpful if the goal was to cause bond yields to soar. Of course, Trump did say that he wouldn’t reappoint Powell. I would also add that the Biden administration is doing as much as it can for the ‘gold bid/bond offer’ equation, for example by allowing the seizure of Russian assets to aid Ukraine.
Despite these factors, gold fell 2.3% last week, and wheat rallied, so the wheat-priced-in-gold historic low that I flagged last week had a nice pop.
This should be an important week with the Quarterly Refunding Announcement, FOMC meeting on Wednesday and NFP Friday. I don’t have a strong opinion on QRA; I would only note that the November 1 announcement which shifted issuance to bills over coupons helped spark a dramatic fall in long-end yields. For example, the 30y fell from 4.93% on Oct 31 to 3.80% on Dec 27. I doubt that happens again. The FOMC will hold rates steady as other financial conditions tighten (long rates up, USD up. $/yen has rallied 12% this year to a new high 158.33). Payrolls expected 250k from 303k last.
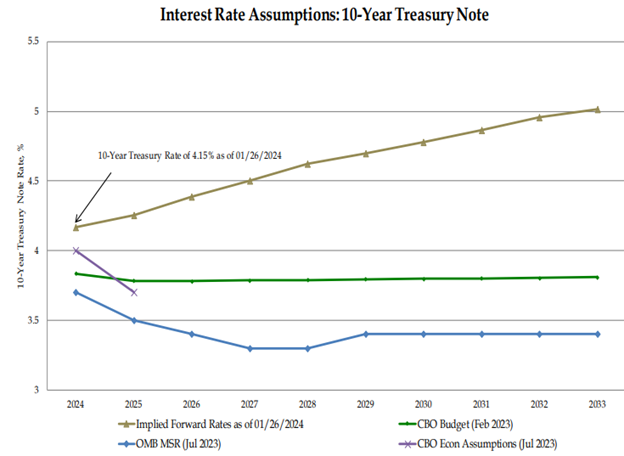
Here’s a fun chart that shows our government at work (from page 13 of last quarter’s Treasury presentation on debt). OMB and CBO completely disregard market prices in their 10y ‘estimates’.
https://home.treasury.gov/system/files/221/TreasuryPresentationToTBACQ12024.pdf

Below is another somewhat interesting chart that shows the US savings rate. Even with t-bills north of 5% the current savings rate is just 3.2%. For historical perspective, in July 2005 it hit 1.4%. Since late 2008 the lowest level is June 2022 at 2.7%. Is a low savings rate a reflection of buy-now to beat further price increases? Or just a sign of stressed households?

One other interesting note from BofA’s Hartnett: The top ten stocks are a record 34% of S+P market cap.
A FEW NOTES ABOUT SOFR OPTIONS
Although short end contracts sold off this week, there is consistent buying of SFRU4 9600 calls and SFRZ4 9600/9700cs. SFRU4 settled 9484.5, down 4.5 on the week, and the 9600c settled 3.75 with 291k of open interest, the most of any Sept call. SFRZ4 settled 9500.0 and the 9600/9700cs settled 5.25 (8.75/3.50) with open interest 334k and 363k, easily the most open interest of any Dec calls. The only SOFR calls with more OI are M4 9500c 2.0s with 393k and 9550c 1.0s with 458k. On the put side, the bulk of positions are in M4 9487.5 to 9462.5 which all have over 300k, based on various spreads to peg final settlement.
Demand for insurance continues to be weighted toward lower rates ensuing from an economic or financial ‘accident’. With SFRZ4 settling exactly at 9500 or 5%, the 9450p, which is only 17 bps away from the current Fed Effective of 5.33% settled 8.0 (-0.22d). The equidistant 9550c settled 6.5 bps higher at 14.5 (+0.28d). 9600c which is twice as far away as the put settled 8.75 (+0.16d), 0.75 more than the put. Sure, there have been various plays made for a Fed hike, but that is definitely not the fear in the market.
| 4/19/2024 | 4/26/2024 | chg | ||
| UST 2Y | 495.0 | 499.8 | 4.8 | |
| UST 5Y | 464.8 | 469.1 | 4.3 | |
| UST 10Y | 461.2 | 466.9 | 5.7 | |
| UST 30Y | 470.9 | 478.1 | 7.2 | |
| GERM 2Y | 300.0 | 298.8 | -1.2 | |
| GERM 10Y | 250.0 | 257.5 | 7.5 | |
| JPN 20Y | 160.1 | 165.0 | 4.9 | |
| CHINA 10Y | 225.6 | 230.6 | 5.0 | |
| SOFR M4/M5 | -68.0 | -64.0 | 4.0 | |
| SOFR M5/M6 | -39.5 | -41.5 | -2.0 | |
| SOFR M6/M7 | -13.0 | -12.5 | 0.5 | |
| EUR | 106.55 | 106.93 | 0.38 | |
| CRUDE (CLM4) | 82.22 | 83.85 | 1.63 | |
| SPX | 4967.23 | 5099.96 | 132.73 | 2.7% |
| VIX | 18.71 | 15.03 | -3.68 | |

