Maybe it’s just about supply
September 10, 2023
**********************
On the week, the 2yr yield rose 11.6 to 4.98%, 5y up 11 to 4.394%, 10y +8.7 to 4.254% and 30y up 4.7 bps to 4.33%. Almost an exact reversal of the previous week. Yields remain close to highs of the year.
ISM Service data was a major catalyst at 54.5 vs 52.7 last. Employment, Prices and New Orders all higher. Powell’s emphasis on non-housing services accentuated reaction to the data, as these prices have been stickiest and are relatively labor intensive. SFRU4 and SFRZ4 notched new low settlements for the entire move in the wake of this report, at 9525.5 and 9559.0.
However, it’s not just the data that is weighing on treasuries. More analysts are pointing to supply (both from the Treasury and Corporates) as a major factor for price action. This week brings auctions of 3s, 10s and 30s starting Monday. Amounts are $44b, $35b and $20b. The narrative has shifted away from the stimulative effects of gov’t spending to an uneasy concern about the sustainability of deficit spending at high financing rates. I had seen a clip that the US is now spending $2 billion per DAY on interest payments. Of course, some of that money flows to (and supports) the household sector, accentuated by the move out of bank deposits into higher yielding t-bills and money markets. On the other hand, student loan obligations are re-starting. BBG’s Valerie Tytel notes that student loan repayments since August 1 have totaled $9.2 billion. Consumer finance rates for cars, goods and homes are now restrictive.

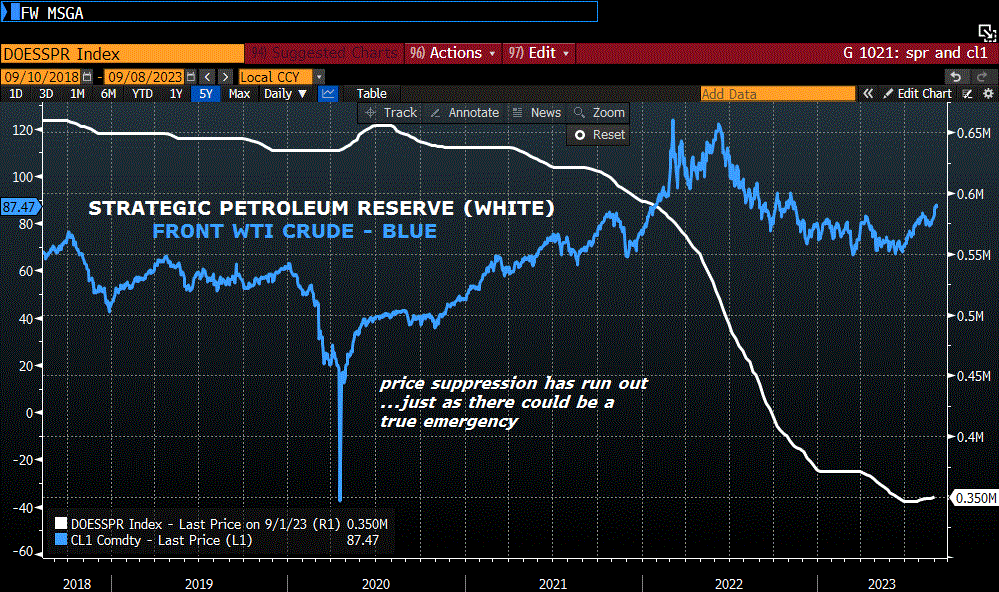
While treasuries are weighed by heavy supply, it’s the opposite case in energy, where the near CL contract has made new highs for the year. CLV3 settled 87.51, as the Saudis and Russia maintain cuts, and I don’t think Biden’s warm handshake with MBS at the G20 meeting is likely to move the needle. Additionally, as the chart shows, selling oil out of the SPR to suppress energy prices is played out as a strategy.
This week brings CPI, expected 3.6% from 3.2% last, with yoy Core expected 4.3% from 4.7%. Retail Sales on Thursday, along with PPI and Jobless Claims. Industrial Production on Friday.
As Dallas Fed President Lorie Logan noted, a skip is in store for next week’s FOMC, but November remains in play. FFV3 settled 9465.0 or 5.35%, close to the current 5.33% Fed Effective Rate. FFX3 settled 9455.0 or 5.45%, more like a coin flip for the Nov 1 FOMC.
The spread SFRZ3/SFRZ4 settled -108 on Friday (9455.5/9563.5). As noted above, SFRZ4 made a new contract low this week at 9559.0. This price still indicates significant easing by the Fed next year, which is also reflected in the SEP. In June, the Fed’s end of 2023 projection for Fed Funds was 5.6% (which pencils in one more hike prior to year end). FFX3 is only 5 bps away from that level. The end-of-2024 FF projection was 4.6%, which implies 100 bps of easing. SFRZ3/Z4 almost syncs up perfectly with the SEP. The market appears to have accepted the idea that squeezing out the ‘last mile’ of inflation will necessitate higher rates for longer and a relatively stingy schedule for eases when they do actually start.
| 9/1/2023 | 9/8/2023 | chg | ||
| UST 2Y | 486.4 | 498.0 | 11.6 | |
| UST 5Y | 428.5 | 439.4 | 10.9 | |
| UST 10Y | 416.7 | 425.4 | 8.7 | wi 426.0/425.5 |
| UST 30Y | 428.2 | 432.9 | 4.7 | wi 433.5/433.0 |
| GERM 2Y | 299.0 | 308.1 | 9.1 | |
| GERM 10Y | 254.9 | 261.0 | 6.1 | |
| JPN 20Y | 134.2 | 139.7 | 5.5 | |
| CHINA 10Y | 262.3 | 266.7 | 4.4 | |
| SOFR Z3/Z4 | -121.0 | -108.0 | 13.0 | |
| SOFR Z4/Z5 | -54.5 | -59.0 | -4.5 | |
| SOFR Z5/Z6 | -4.0 | -6.0 | -2.0 | |
| EUR | 107.77 | 107.03 | -0.74 | |
| CRUDE (CLV3) | 85.55 | 87.51 | 1.96 | |
| SPX | 4515.77 | 4457.49 | -58.28 | -1.3% |
| VIX | 13.09 | 13.84 | 0.75 | |

