Demand from Aspirational Consumers has Softened. Huh?
July 16, 2023 – Weekly Comment
************************************
Burberry’s Q1 “comparable store sales in the Americas fell 8%.” The CFO cited softened demand from “aspirational consumers”. I’m a bit bewildered. What in the hell is an aspirational consumer? In my mind I have an image of someone who pays more than they can afford, using credit, in order to portray an image. Perhaps in that category are the 17% of people that borrowed to buy cars or trucks and have a monthly payment of $1000 or more. Makes me think of the John Prine song ‘Dear Abby’.
Dear Abby, dear Abby
My feet are too long
My hair’s falling out and my rights are all wrong
My friends they all tell me that I’ve no friends at all
Won’t you write me a letter, won’t you give me a call
Signed bewildered
Bewildered, bewildered
You have no complaint
You are what you are and you ain’t what you ain’t
So listen up buster, and listen up good
Stop wishing for bad luck and knocking on wood
Perhaps the aspirational consumer is making her own bad luck. Of course, I had to look up the definition of the individual causing Burberry’s plaid fabric to fray and got this description: “Today’s consumer doesn’t dream of owning something, but becoming someone.” Got it.
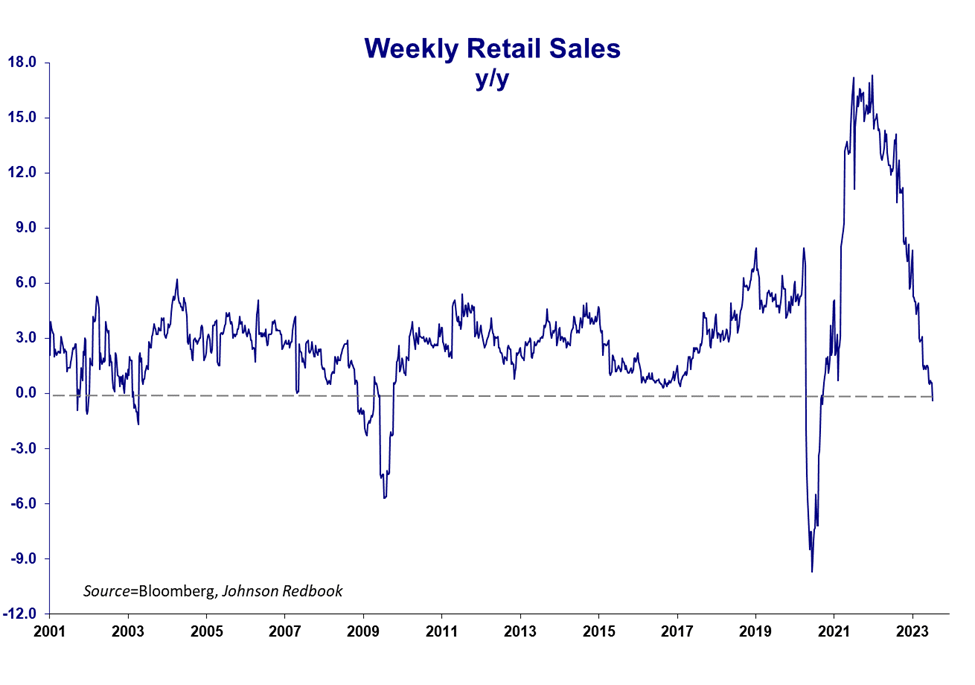
Anyway, it’s not just Burberry. Johnson Redbook same store yoy sales actually contracted. A decline in the aspiration for basic necessities? Rick Rieder (Blackrock) in a BBG interview said this, “When you have a consumer-oriented, service-oriented economy, it’s much more stable than people give credit to.” He argues that recession odds are “grossly overstated… without some massive shock to the system” but also notes that restrictive rates over time will bring inflation down. On the other side, from Steph Pomboy: “Here’s your ‘indefatigable’ consumer. Weekly Same Store Sales just entered contraction. And that’s BEFORE accounting for inflation.”
[chart below on Redbook]
Here’s a tweet from Valerie Tytel of BBG regarding the latest US Fed’l Govt budget numbers:
US racks up near $1T Annualized Debt Costs. In June alone: 18% of spending went toward interest expense. Vs a year ago, Total spending rose 15%, up $100bn. Interest expense climbs 25%. Tax receipts fall 9.2%. Never before have tax receipts suffered such a drop without a US recession. (emphasis added)
Cameron Crise notes interest payments as a % of GDP aren’t as bad as the 1980s, but it “seems unlikely that current fiscal trends (with a deficit of 8.5% of GDP) are sustainable.”
Retail Sales are released Tuesday, expected +0.5 m/m vs +0.3 last.
The big consumer and driver has become US government. According to the Fed’s Z.1 quarterly report, from Q1 2019 to Q1 2023, Household debt has increased from $15.68T to $19.16T, or 22%. Business sector debt from $15.79T to $19.97T or 26.5%. Federal Gov’t exploded from $18.09T to $27.15T or 50%. The Fed’s efforts to restrain growth and inflation are somewhat nullified by massive gov’t deficits. That is, until capital markets become less inclined to buy US bonds. This past week, the market was happy to finance the US deficit at lower yields. Lower than expected inflation data (3% CPI yoy, PPI 0.1%) sparked an inspired rally. The five-yr dropped over 30 bps in yield to 4.03%. Tens eased by 23bps to 3.816%. On the SOFR curve, Dec’25 and March’26 led the way, rallying 40 bps to 9665 and 9669, at yields just over 3.7%. Financial conditions eased significantly, with SPX gaining 2.4% on the week and the dollar index closing at 99.91, the lowest level since April 2022, and down 12.5% from last September’s high.
While next week’s 25 bp hike is nearly fully priced, with FFQ3 settling 9469.0 or 5.31% essentially at what will be the new Fed Effective at 5.32 or 5.33%, the Fed needs to tamp down on forward rates to prevent inflation expectations from rekindling. Inflation comparisons are likely to become harder for the Fed. John Mauldin’s weekend note cites Ed Easterling and Jim Bianco: if CPI readings were to remain at a steady 3% annualized rate month-over-month through the end of the year, then inflation at the end of the year will be 4.3%. If inflation runs at 0% the rest of this year, then the rate will be about 2.8%.
Waller’s speech late Thursday was an effort to convince the market that funding rates will likely increase and will stay relatively high. Key takeaways are, 1) that there is scant evidence of a credit crunch related to banking turmoil and bankruptcies in March. 2) That the Fed’s ‘forward guidance’ effectively tightened before the rate hikes even occurred, meaning that arguments that lags have yet to work their way through the economy are less convincing. 3) That large [rate hike] shocks force the economy to react and adjust more quickly than small shocks, and therefore it’s not likely that the economy will encounter a Wile E Coyote type ‘cliff’.
In a hawkish summary from Waller:
I see two more 25-basis-point hikes in the target range over the four remaining meetings this year as necessary to keep inflation moving toward our target. Furthermore, I believe we will need to keep policy restrictive for some time in order to have inflation settle down around our 2% target.
Key excerpt on the Fed’s “forward guidance”:
The 2-year yield went from 25 basis points in September 2021 to around 200 basis points by the March 2022 FOMC meeting. Even though we had not raised the policy rate nor did we get the policy rate up to 200 basis points until August 2022, the markets priced in a nearly 200 basis point increase in the expected policy rate before we actually raised it. This forward guidance effectively shaved off about 6 months from the usual 12- to 24-month lag that one might conjecture would be needed to see the 200 basis points of actual tightening affect the economy.
Powell had also noted the increase in the 2-year yield prior to actual rate hikes, but I find Waller a bit disingenuous in implying that the Fed deftly controlled the narrative. Rather, the market knew the Fed was behind the curve and forced action.
Waller also mentioned the Phillips Curve. From Investopedia, “The Phillips curve is an economic theory that inflation and unemployment have a stable and inverse relationship.”
Why do these guys keep talking about the Phillips Curve? It doesn’t work. Listen up buster, and listen up good: If you have to describe actual economic outcomes by saying the shape of the theoretical curve adjusted and changed, then it’s worthless. Move on. Live in the NOW.
What we do know is that funding rates are higher than inflation measures, a fact which will be punctuated by next week’s hike in Fed Funds. Waller didn’t mention the yield curve, but short rates well above longer term yields implies a lack of business demand for longer term borrowing to invest in longer term projects. Policy rates are restrictive. As Rieder said, just “…let them marinate through the system.”
OTHER THOUGHTS / TRADES
I’m more in the camp that a shock could easily come and create a harsh market reaction. The move in $/yen from 145 to 138 this month is a shot across the bow that funding strategies based on yen rates could blow up spectacularly. 10y JGB is back up at 47 bps, nearing the 50 bp cap. BOJ policy meeting is July 27/28.
In terms of a possible economic ‘cliff’ Reuters notes: U.S. Chapter 11 bankruptcy filings jumped 68% in the first half of 2023 from a year earlier, Epiq Bankruptcy, a provider of U.S. bankruptcy filing data, said on Monday [7/10]. Danielle DiMartino Booth says 60% of people who bought homes in 2022/2023 are struggling to make payments.
There has also been significant buying (over 100k) SFRZ3 9487.5/9500cs for 2.5. Settled 2.0 vs SFRZ4 9468.0. Pay 2.5 to make 10. Probably requires easing before the end of the year to fill out, but if the July hike is the last one, and the market becomes convinced that the July hike will be reversed in December, this call spread could easily play. Contract expires 15-Dec and FOMC is 13-Dec.
I saw several articles that conclude, if the Fed is done hiking, then buy duration. While I believe the July hike is likely the last, I think the Fed will try awfully hard NOT to ease until forced. I think the curve could steepen, led by the short end, without much of a yield drop on the long end. The 30yr yield appears to have had a false breakout above 4.0%, having gotten to 4.047% on 7/7 only to fall back to 3.92% on Friday. Another move over 4% will catch a lot of traders offsides.
| 7/7/2023 | 7/14/2023 | chg | ||
| UST 2Y | 492.9 | 474.7 | -18.2 | |
| UST 5Y | 433.3 | 402.9 | -30.4 | |
| UST 10Y | 404.6 | 381.6 | -23.0 | |
| UST 30Y | 403.1 | 392.1 | -11.0 | |
| GERM 2Y | 325.3 | 321.0 | -4.3 | |
| GERM 10Y | 263.7 | 251.2 | -12.5 | |
| JPN 30Y | 126.8 | 138.2 | 11.4 | |
| CHINA 10Y | 264.3 | 264.7 | 0.4 | |
| SOFR U3/U4 | -96.0 | -123.5 | -27.5 | |
| SOFR U4/U5 | -66.5 | -76.0 | -9.5 | |
| SOFR U5/U6 | -14.0 | -13.0 | 1.0 | |
| EUR | 109.70 | 112.26 | 2.56 | |
| CRUDE (CLU3) | 73.77 | 75.32 | 1.55 | |
| SPX | 4398.95 | 4505.42 | 106.47 | 2.4% |
| VIX | 14.83 | 13.34 | -1.49 | |
https://www.mauldineconomics.com/frontlinethoughts/flip-side-of-the-inflation-coin
https://www.investopedia.com/terms/p/phillipscurve.asp

