Heroic Hopes for Ease Vanish
June 25, 2023 – Weekly Comment
***********************************
Did they get you to trade
Your heroes for ghosts?
-Pink Floyd
This week I am just noting a few odds and ends, interesting (to me) as individual snippets, but I am not trying to weave a broader story. I start with a chart of FFQ3 to FFF4. This spread represents hiking/easing prospects over the last half of this year. The next FOMC meeting is July 26 (which directly affects FFQ3; there is no FOMC in August). Then there are meetings Sept 20, Nov 1, and Dec 13 which occur before the January’24 contract.

This spread has rallied from a deeply inverted -76.5 on May 4 (essentially pricing three 25 bp cuts in the last half of the year) to -1.5 on Friday, which indicates that all expectations of ease have been squeezed out. This is exactly Powell’s goal: to convince the market that easing is not forthcoming in the near term. Although the Fed declined to overtly raise the FF target at the last FOMC, this price action IS A HIKE. From May 4 to Friday, FFF4 went from a rate of 4.11% to 5.24%.
This tweet from TO at PNT Options on Friday succinctly captures the dashed hopes of easing in 2023:
HUGE LIQUIDATIONS IN DEC 23 SOFR UPSIDE AS PAPER THROW IN TOWEL ON RATE CUTS THIS YEAR, WHICH IS PUSHING VOLS LOWER
SFRZ3 95.50/96.50 CS SOLD AT 7.5 100k
SFRZ3 96.50/97.50 CS SOLD AT 3.5 70k
SFRZ3 95.75/96.75 CS SOLD AT 6 20k
THIS IS EQUIVALENT OF SELLING 25000 STRADDLES
SFRZ3 9550c settled 14.75 ref 9478.5, open interest fell 87k to 258k. 9650c settled 7.0, open interest rose by 24k to 446k. See other OI changes here:
https://www.cmegroup.com/daily_bulletin/current/Section51_STIR_Call_Options.pdf
While SOFR vol declined, the next chart is somewhat interesting over a longer time frame. It’s the VIX with TY 1m vol over the past five years.
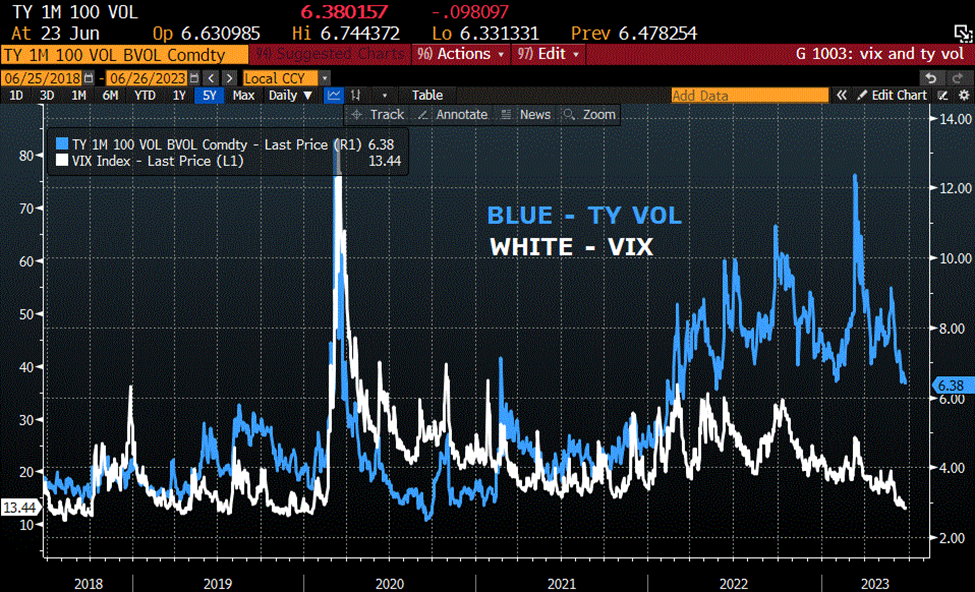
For me, the takeaway is that VIX, at 13.44 on Friday, is essentially down to pre-Covid levels, while TY vol remains substantially higher than 2018/2019 marks, even though it’s near the lows of the past year and a half. I am not suggesting ‘buy vix, sell TY’ here, but I do find it interesting that, with near record inversion of 2yr/10yr spread at -100 bps (4.748%/3.742%), demand for protection on longer dated treasuries remains relatively robust. Of course, with the 10yr yield more than 1.25% below the SOFR (funding) rate, perhaps concern about the possibility of large adjustments is a reasonable risk to hedge. On the other hand, one could say the same for equities.
On that topic, Warren Buffet is known for looking at total market cap as a percentage of GDP. That ratio is currently about 166%. It has declined from a peak of around 200% in October 2021, but is still historically elevated. [link at bottom] I took a look at just the current big 7 tech names as a percent of nominal GDP. Those stocks are AAPL, MSFT, AMZN, GOOGL, META, TSLA, NVDA. At the end of Q3 21, these seven were about 43% of GDP. By the end of Q3 22, they had declined to 31% of GDP and at the end of 2022, to 26%. As of now (using Q1 nominal GDP) the ratio is back over 40%. I’m not drawing conclusions except to say that the dominance of a few large tech stocks being correlated to a decline in VIX makes me inclined to stand aside.
There are several items of note this week. Auctions of $42b 2y on Monday, $43b in 5s on Tuesday and $35b in 7s on Wednesday, along with $22b 2y FRN. Including last week’s 20y, the amount of new cash being raised is >$100b.
On Tuesday and Wednesday, there is a central banking forum in Sintra. Wednesday’s Policy Panel is at 14:30 Sintra time; 9:30 EST. Bailey, Lagarde, Powell and Ueda will be participating, moderated by Sara Eisen. Also on Wednesday, the Fed releases Bank Stress Test results (which don’t seem to have been particularly valuable recently).
https://www.ecb.europa.eu/pub/conferences/html/20230626_ecb_forum_on_central_banking.en.html
On Friday, the PCE Deflator is released, expected yoy 3.8% from 4.4% last. Core expected 4.7% from 4.7%. Regarding inflation, Jim Bianco has noted that base effects will make CPI quite low this month (released July 12) but it may mark the low for the year. From May 2022 to June 2022 the CPI Index went from 281.26 to 294.7, a one-month surge of 1.2%. Due to base effects that number now falls out of the yoy CPI calculation, meaning inflation released on July 12 is only expected to be around 3%. However, due to the same base effects, the comparisons will start getting more difficult as the year progresses. Bianco and others think two more hikes will be completely justified. My bias is that duration is more important than level, and employment data are showing signs of a negative turn. Note that several presentations in Sintra on Tuesday will focus on inflation.
| 6/16/2023 | 6/23/2023 | chg | ||
| UST 2Y | 472.9 | 474.8 | 1.9 | |
| UST 5Y | 400.2 | 399.5 | -0.7 | |
| UST 10Y | 377.3 | 374.2 | -3.1 | |
| UST 30Y | 385.8 | 382.1 | -3.7 | |
| GERM 2Y | 312.3 | 310.6 | -1.7 | |
| GERM 10Y | 247.4 | 235.3 | -12.1 | |
| JPN 30Y | 122.8 | 121.4 | -1.4 | |
| CHINA 10Y | 267.9 | 267.4 | -0.5 | |
| SOFR U3/U4 | -124.0 | -124.0 | 0.0 | |
| SOFR U4/U5 | -70.5 | -73.5 | -3.0 | |
| SOFR U5/U6 | -15.5 | -14.5 | 1.0 | |
| EUR | 109.45 | 108.95 | -0.50 | |
| CRUDE (CLQ3) | 71.93 | 69.16 | -2.77 | |
| SPX | 4409.59 | 4348.33 | -61.26 | -1.4% |
| VIX | 13.54 | 13.44 | -0.10 | |
https://www.gurufocus.com/stock-market-valuations.php

