Keeping at it
June 18, 2023 – Weekly Comment
************************************
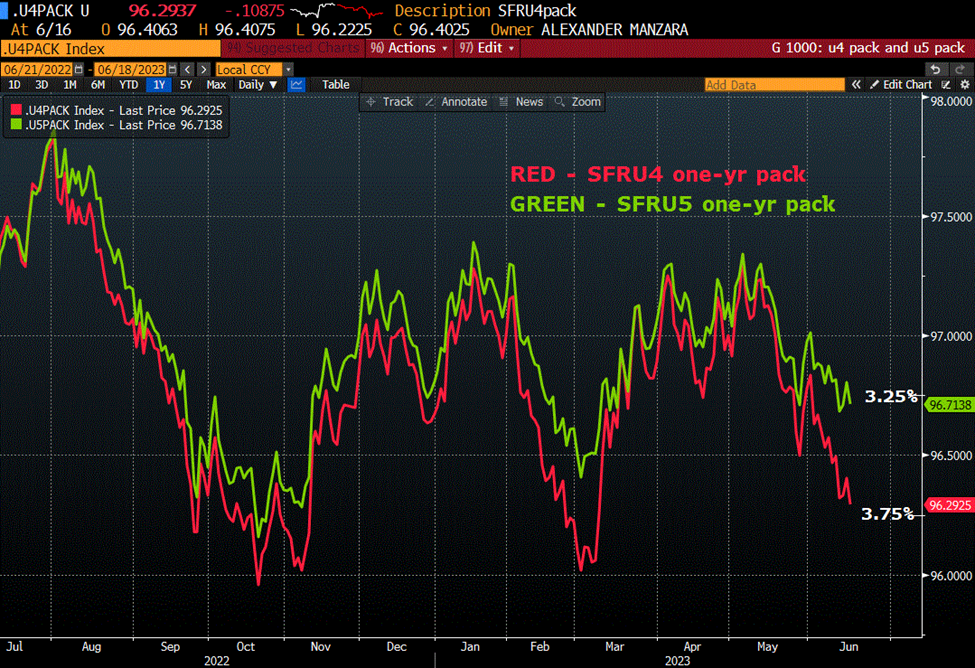
According to the old way of doing things, this coming week SFRU4 would become the first red. On BBG, given that the SFRM3 contract remains listed, the first red will become SFRM4. It doesn’t matter, for the purposes of this note we consider the forward packs which are one and one-quarter year forward, and two and one-quarter years forward, which I call the red and green sofr packs, and start with September.
From Powel’s press conference:
…it will be appropriate to cut rates at such time as inflation is coming down really significantly. And again, we’re talking about a couple of years out. I think as anyone can see, not a single person on the committee wrote down a rate cut this year, nor do I think it is at all likely to be appropriate if you think about it. Inflation has not really moved down. It has not so far reacted much to our to our existing rate hikes. And so we’re going have to keep at it.
I believe Powell’s main objective has been to convince economic participants that funding rates are going to stay high. It’s not really the level, it’s the duration. It is already the case that the FF rate has surpassed every measure of annualized inflation except for CPI ex-food and energy which was 5.3% at last print, vs the FF target range of 5.0-5.25%. The headline CPI number was 4.0%, PCE deflator 4.4%, Core PCE 4.7%, NY Fed’s Underlying Inflation Gauge ‘full data’ 3.5% and ‘prices only’ 3.0%. Avg Hourly Earnings yoy is 4.3%. The signal the Fed used to impress upon the public that they’re serious this time!, is the rise in the Fed Fund forecast according to the ‘dot plot’. For the end of 2023 the dot was raised to 5.6% from 5.1%, indicating the possibility of 2 more hikes, and the end-of-’24 dot was raised to 4.6% from 4.3%.
Let’s look at the weekly changes of the new red pack (U4 one-yr) and green pack (U5 one-yr). SFRU4 pack fell 17.5 bps on the week from 9646.75 to 9629.25 (low since SVB). SFRU5 pack fell nearly 9 from 9680.625 to 9671.75. The 2-yr note rose 12.7 bps from 4.602% to 4.729%. During this calendar year, the range on the U4 pack has been 9733.75 (~2.66%) to 9601.375 (~3.99%). Friday’s close ~3.71%. So the Fed has succeeded in nudging up this forward rate even as inflation data have softened. However, the forward rate is STILL 137 bps below the current Fed Effective of 5.08%. I.e., we’re NOT “…talking about a couple of years out.” The green pack is 180 bps under current EFFR.
Inversion is already long in the tooth
The 2/10 treasury spread ended the week at -95.5 bps. It has been consistently inverted (below -15 bps) since July 2022, and is nearing the low for the year (-109). That’s nearly a full year of inversion. In the mid-2004 to 2006 hiking cycle the LOW of this spread was -19 bps in Nov 2006, five months after the last hike. It didn’t turn consistently positive until June ’07, followed by the first ease in September. The duration of time the spread was consistently under +5 bps was a year, June’06 to June ’07. In the year 2000 the spread was inverted through that calendar year with a low of -56. It flipped positive right at the start of 2001. The Fed had hiked from 4.75% in June 1999 to 6.5% in May 2000; the first ease occurred right at the start of 2001 as the dotcom bubble began to implode. The duration of inversion at that time was eleven months, from Feb 2000 to the start of Jan 2001.
There’s an insightful tweet from Steph Pomboy @spomboy 6/11
“…Every day that the Fed holds rates here is another day an adjustable rate mortgage resets, a corporate bond matures or a floating rate lev loan notches up. Every day is tightening. And by the time the fed DOES cut, mkts will be tightening on deteriorating credit quality.”
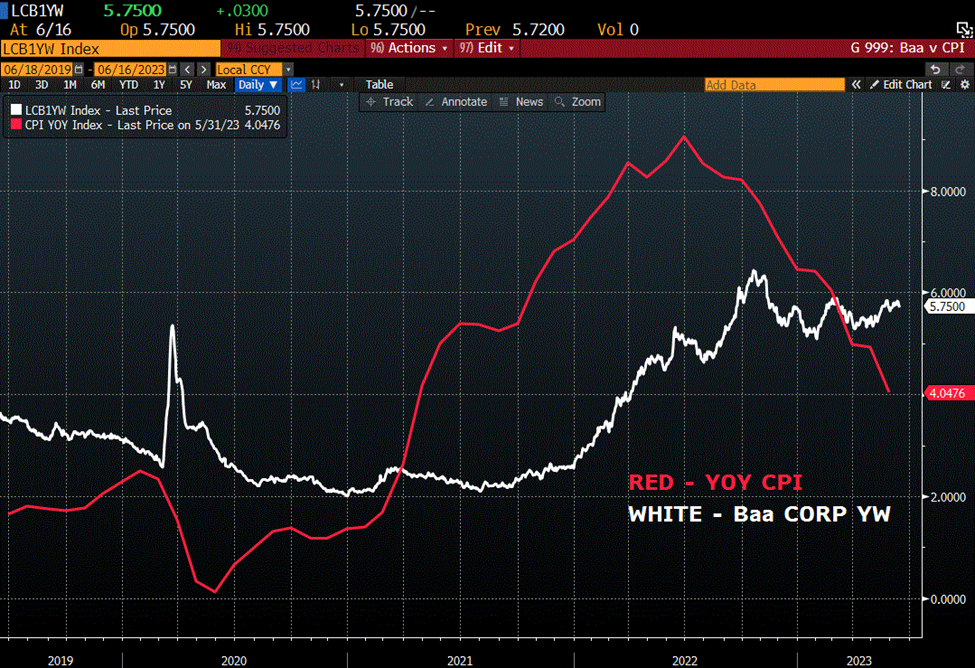
If the Fed lengthens the duration of the curve inversion and continues to jawbone forward rates somewhat higher, then “every day is a tightening.” Perhaps another chart that helps emphasize this idea is the following, inflation vs the corporate Baa yield. If one considers the inflation rate as a general increase in the prices of output then as inflation exceeds the corporate bond rate, there is a huge incentive for companies to borrow and expand. It’s analogous to positive carry. Borrow at a rate below inflation and sell at prices that continue to rise. But if inflation falls below the corporate bond rate, that incentive disappears. An inverted curve suggests much the same, inasmuch as long term yields represent future potential growth.
Next year is the election. Loan delinquencies are already on the rise. A Barclay’s note suggests that reimposition of debt servicing payments on student loans could have an impact of as much as $15.8 billion per month, which will negatively impact retail sales. I seriously doubt the headwind will be that strong; many of those loans simply won’t be paid and will be perpetually extended without serious collection efforts. The broad point is that previous Fed hikes are still working through the system, and credit conditions are tighter than they were previously. Impediments to growth could still be offset by increased government spending as the election nears, but the duration of the current curve inversion suggests that growth will soon falter and easing isn’t as far off as Powell would like to believe.
Powell delivers semi-annual testimony to Congress this week, appearing before the House on Wednesday and the Senate on Thursday. 20 year treasury auction on Wednesday, $12 billion.
| 6/9/2023 | 6/16/2023 | chg | ||
| UST 2Y | 460.2 | 472.9 | 12.7 | |
| UST 5Y | 391.6 | 400.2 | 8.6 | |
| UST 10Y | 374.1 | 377.3 | 3.2 | |
| UST 30Y | 388.4 | 385.8 | -2.6 | |
| GERM 2Y | 291.6 | 312.3 | 20.7 | |
| GERM 10Y | 237.7 | 247.4 | 9.7 | |
| JPN 30Y | 125.3 | 122.8 | -2.5 | |
| CHINA 10Y | 269.0 | 267.9 | -1.1 | |
| SOFR U3/U4 | -136.0 | -124.0 | 12.0 | |
| SOFR U4/U5 | -64.5 | -70.5 | -6.0 | |
| SOFR U5/U6 | -6.5 | -15.5 | -9.0 | |
| EUR | 107.50 | 109.45 | 1.95 | |
| CRUDE (CLQ3) | 70.33 | 71.93 | 1.60 | |
| SPX | 4298.86 | 4409.59 | 110.73 | 2.6% |
| VIX | 13.83 | 13.54 | -0.29 | |

