Barely Squeakin’ By
May 22, 2022 – Weekly Comment
Retail can be a tough business. Consumer spending accounts for 2/3rds of GDP, as we’re often reminded. In any case, retail stocks have taken an absolute shellacking in the past month or so. From April 18 (this year’s tax date) to Friday, May 20, here are some changes on a closing basis:
Target (TGT) -37%
AMZN -30%
Macy’s (M) -29%
Costco (COST) -28%
Nordstrom (JWN) -26%
Walmart (WMT) -23%
Best But (BBY) -22%
Misses from WMT and TGT accelerated last week’s carnage. Reporting this week are COST, M, JWN and BBY. Powell constantly marvels at the strength in the labor market. Yes, it’s true, the JOLTS data shows more openings than people looking for work. But there’s something else going on… if only there were some clues. On the earnings call, TGT’s CEO said there was a “dramatic change in sales mix” in Q1 with more customers buying private-label goods. Consumers are stretched. BBG notes that US net worth hit a record $142T at the end of last year and cites JPM with an estimate that $5T has been shaved this year, “and could reach $9T by year-end.” I’m guessing JPM might be a bit conservative. Total stock market cap to GDP ended 2021 at a record 200%. Below is a chart of the S&P 500.
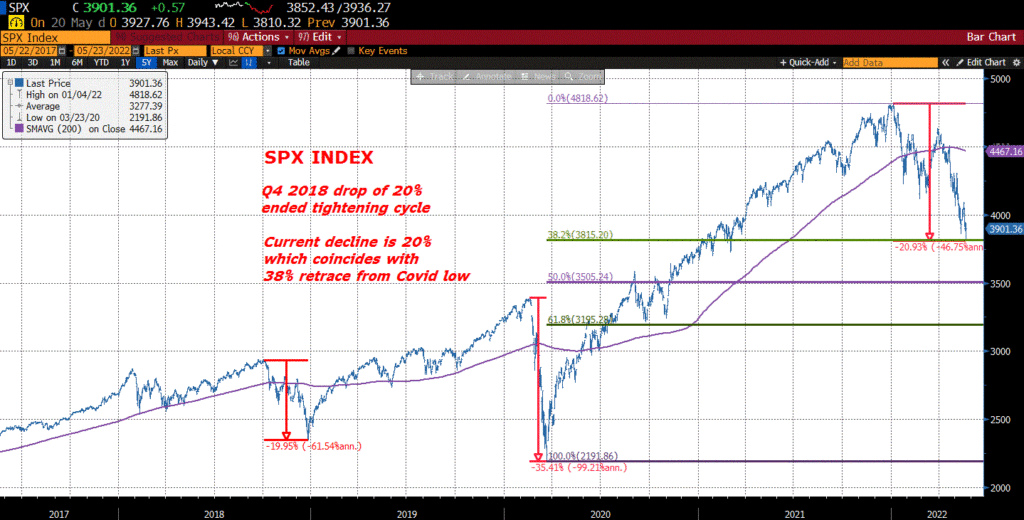
It’s not super easy to see on this chart, but the 2018 tightening cycle ended with a 20% decline in SPX. At Friday’s low, SPX had declined 20% from the high at the start of the year. The intervening sell-off associated with Covid was a plunge of 35% culminating in March of 2020. Friday’s low in the index was 3810. The 38.2% retracement from the March 2020 low to the start of this year’s high is 3815. So, there were two big technical levels which suggested support: the 20% decline off the high, and the Fibonacci retracement. Friday’s late bounce was exacerbated by May option expiration. This price action suggests (to me at least) that the retracement levels are a good guidepost for the rest of the year. The 50% level is 3505. The 61.8 retracement is 3195 which is close to a 35% decline off the high (which would equal the percentage decline seen in 2020). The 200 DMA appears to have rolled over.
Last weekend I spent some time on the one-year Eurodollar calendar spreads. In the past week the message has become a bit more dramatic: EDZ2/EDZ3 settled -7.5, down from +6.0 the previous Friday. This is the nearest one-year calendar spread to have inverted. Partially the weakness in EDZ2 reflects credit concerns and end-of-year pressure. However, SFRZ2/SFRZ3 settled at just 0.5 bp and was printing zero, vs +15 the previous Friday. FFF3/FFF4 settled 11.0 and should probably be sold vs SFR spread (although in looking at the chart history, a level of 15 to 18 is the more appropriate level to enter a short, with a target of 0 to 3) [this is NOT A RECOMMENDATION]. Also worth a note is that FFQ2 is exactly pricing the idea of 50 bp hikes at the June and July FOMCs, which would take the Fed Effective rate (EFFR) from the current 83 bps to 183 bps by the end of July. FFQ2 settled at 9817.0 or 1.83.
5 and 10 yr inflation breakevens have been coming down. The 5yr peaked in March at 368 and is now 290. The 10yr peaked in April at 303 and is now 258. For a bit more historical perspective, the ten-year spread spent the first three quarters of 2018 between 200 and 220. The average in 2019 was about 175. On Friday U of Mich releases the final May survey of 5-10 year inflation expectations. From 2017 through 2019 it ranged between 2.6 to 2.3%. The peak this year is 3.1% and it’s expected at 3.0. More importantly, Friday is also the release for the Fed’s preferred measure of inflation; PCE yoy prices expected 6.2 from 6.6 and Core expected 4.9 from 5.2. FOMC minutes on Wednesday. Auctions of 2, 5, 7 year notes Tues-Thursday.
On Tuesday Powell makes introductory remarks at an economic summit, and Brainard speaks Wednesday. (Fighting inflation Is JOB NUMBER ONE). The June 15 FOMC is three and a half weeks away. I no longer pay much attention to regional Fed Presidents, however, Esther George is speaking at an Ag Summit on Monday evening. With widespread forecasts of food shortages (and many other much more dire projections), this event may be of particular interest (though the title is ‘Help Wanted in Agriculture’). From The KC Fed website Q1 survey, farm credit conditions are strong, with farmland values up approx. 25% yoy. However, here’s an excerpt: “The outlook for ag credit conditions remained optimistic alongside persistently strong commodity prices. However, many lenders expected conditions to soften in coming months alongside pressure to profit margins from higher input costs and harsh drought conditions in large portions of the country.”
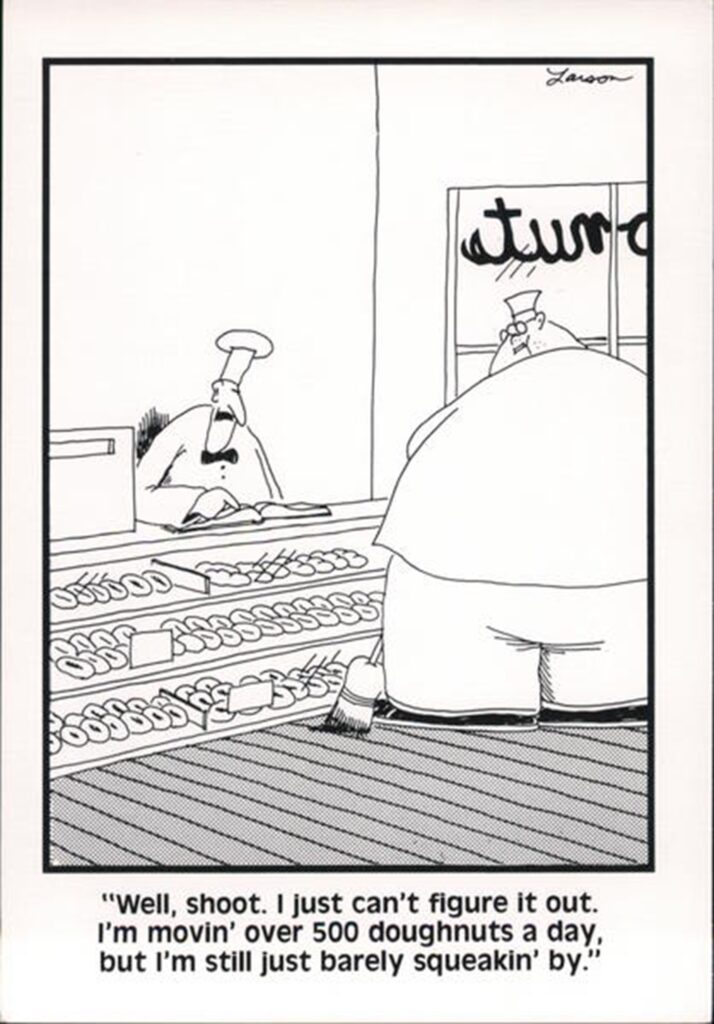
Can’t get fertilizer. A friend of mine said it’s hard to get a certain hydraulic oil for the tractors (so the idea now is to stockpile). Oh that’s right, we’re working on the demand side. Time to put that donut clerk on a crash diet.
OTHER MARKET THOUGHTS/ TRADES
EDM3/EDM4 is the lowest one-year calendar on the strip and it settled at a new low for the move of negative 40.5. The high of the year in this particular spread was positive 36 on Jan 10. SFRM3/M4 is also the lowest, settling at a new record low -39.0. These forward one-yr spreads are screaming recession. Since 1999, the low in the first red to first green (5th to 9th quarterly contracts) has been -16.5 in 2019. In 2006 the low was -12.0. In the 4th to 8th the current level is -33.0 (EDH3/EDH4). In Dec 2006 the low was -26.5 and in 2019 the low was -25.0. There are several analysts who are somberly predicting recession, as if they’ve run all the data through a proprietary econometric model which dispassionately spit out high odds of declining activity. Let me say it again: short end dollar futures spreads are SCREAMING recession.
| 5/13/2022 | 5/20/2022 | chg | ||
| UST 2Y | 259.7 | 257.9 | -1.8 | WI 262.0 |
| UST 5Y | 288.4 | 280.3 | -8.1 | WI 280.2 |
| UST 10Y | 293.1 | 278.1 | -15.0 | |
| UST 30Y | 308.8 | 299.2 | -9.6 | |
| GERM 2Y | 10.6 | 34.2 | 23.6 | |
| GERM 10Y | 94.8 | 94.4 | -0.4 | |
| JPN 30Y | 99.8 | 98.9 | -0.9 | |
| CHINA 10Y | 281.9 | 281.9 | 0.0 | |
| EURO$ M2/M3 | 148.5 | 149.0 | 0.5 | |
| EURO$ M3/M4 | -27.0 | -41.5 | -14.5 | |
| EURO$ M4/M5 | -6.0 | -6.5 | -0.5 | |
| EUR | 104.13 | 105.63 | 1.50 | |
| CRUDE (active) | 108.63 | 110.28 | 1.65 | |
| SPX | 4023.89 | 3901.36 | -122.53 | -3.0% |
| VIX | 28.87 | 29.43 | 0.56 | |

