Discomfort Index
November 14, 2021 – Weekly comment
The White House @WhiteHouse /July 1, 2021 (tweet)
Planning a cookout this year? Ketchup on the news. According to the Farm Bureau, the cost of a 4th of July BBQ is down from last year. It’s a fact you must-hear(d). Hot dog, the Biden economic plan is working. And that’s something we can all relish.
Here’s a suggestion for November 14
Having Thanksgiving dinner? Plan to ‘give’ a little more. The sixteen cents you saved on the 4th BBQ has vanished. Feeling like a turkey? “USDA’s Turkey Market Report showed that smaller 8 to 16 pound frozen turkeys were selling for $1.41 per pound, up from $1.15 the year before, a 22% increase.” Driving? How about those gas pump(kin) pie-in-the-sky prices. Might as well stay home and watch the Lions/Bears, who both have enviable records (according to gov’t statisticians). Pass the Wild Turkey.
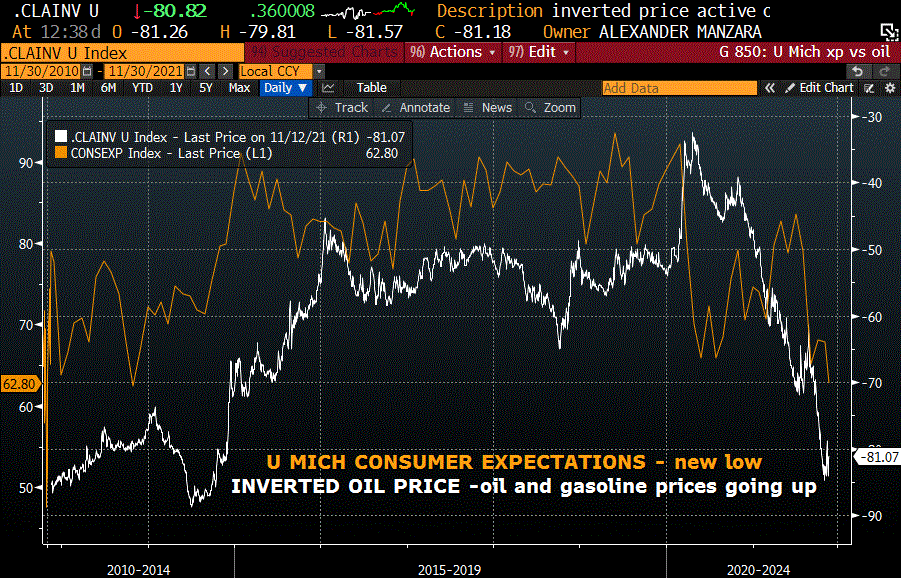
Much has been made of last week’s plunge in consumer expectations to 62.8, from a pre-pandemic level over 90. I didn’t see any news coverage that found the data mysterious. Inflation concerns are weighing on households. On the chart below I inverted the price of oil; the falling white line represents HIGHER oil prices. There appears to be a correlation with consumer expectations.

The question is whether discouraged households begin to impede future growth, thereby bringing inflation back down. I think there’s implicit belief in this sort of self-leveling adjustment, but I personally think that current dynamics have a way of self-reinforcement.
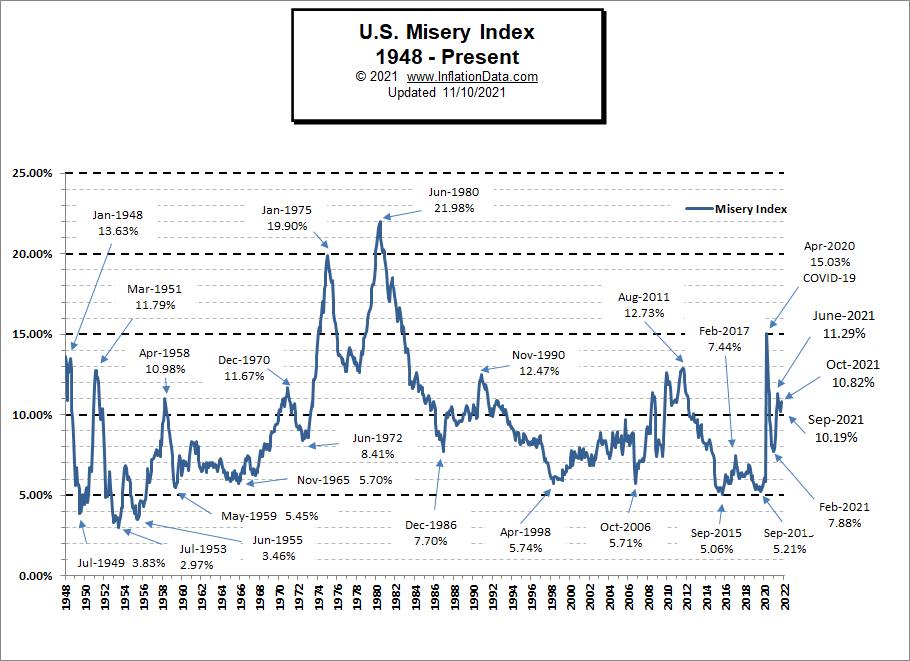
In the early 1970’s. Arthur Okun (chair of the CEA under Lyndon Johnson) introduced a “discomfort index” to track the “country’s economic welfare by using the simple sum of the inflation rate and unemployment rate.” It became known as the Misery Index. This index was high and relevant for years. Carter blamed Ford. Reagan blamed Carter. The current level is now about where it was before it exploded higher in the 70’s. The point is, ‘self-correcting’ and transitory don’t necessarily occur in an environment of bad policies accompanied by supply shocks.

Early last week Clarida allowed that conditions could be in place for rate lift-off by the end of next year. By Friday, Jan’22/Jan’23 Fed Fund spread was 63.5, essentially forecasting 2.5 Fed hikes by the end of next year. FFF2 is 9992.0 or 8 bps, spot-on the current Fed Effective rate. FFF3 is 9928.5 or 71.5 bps. The market has galloped ahead of the Fed with focus on the inflation part of the misery index. There was simply no way to ignore Wednesday’s 6.2% CPI print. At the end of last week, Mohamed El-Erian bluntly said, “You can’t simply dismiss them [price pressures] as transitory… It is going to go down in history as one of the worst inflation calls.” He added, “I desperately want to be wrong on this call because if inflation ends up to be hotter for longer, it has very unfortunate economic, financial, institutional, social and political implications.” I think we’re seeing the start of that now. The Fed’s narrative has been that demographics and healing supply chains will overcome the myth of higher entrenched inflation expectations. As Winston Zeddemore said to Ray Stantz in Ghostbusters: “Myth? Ray, has it ever occurred to you that maybe the reason we’ve been so busy lately is ‘cause the dead HAVE been rising from the grave.” The resurrection of the Misery Index.
Let’s look for a minute at EDZ3 contract. It settled Friday at 9839.0 or 1.61%, just above the ten year yield of 1.577%. On the week it was up 28.5 bps in yield. (Tens were up 12.7 bps). The contract closed just one bp higher on Friday than Thursday’s new low for the year. Keep in mind that in June, the SEP Fed projection for Fed Funds (median) was 0.6% at the end of 2023, with Core PCE inflation 2.1%. In September the median FF projection was 1.0% for the end of ’23 with Core PCE 2.2%. After both of these meetings, EDZ3 sold off. After the sell-off in late June, the contract rebounded to a pre-FOMC high. A week after the September meeting, there was a brief rally, which also fizzled. Currently, a bear market in Eurodollars has gained strength.
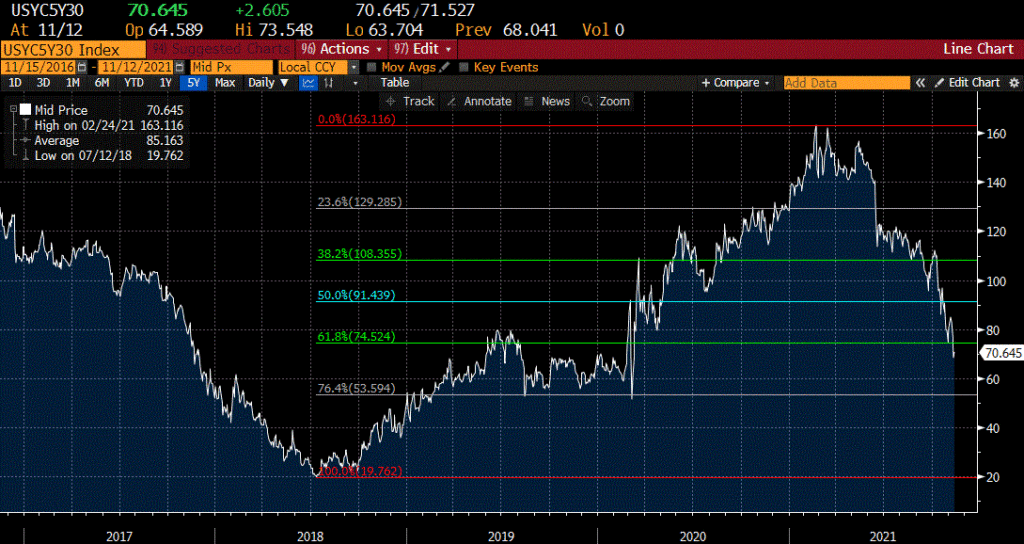
Apart from some brief retracement rallies, the 5/30 treasury spread has declined since the June FOMC, closing Friday at 71 bps. The large initial decline coincided with the June FOMC; prior to that meeting the spread was 140 (off the year’s high at 163). It’s now testing a congestive area of 56 to 70 from late 2019. Last week there were a few large calendar spreads that traded, for example a seller of 20k EDZ3/EDZ5 on Tuesday at 28.5 (settled 22.5 on Friday). Later in the week, there was more of a two-way trade in back spreads. The point is this: like the 5/30 spread, back month ED calendars have declined since June. On a constant maturity basis, green/blue pack spread (3rd to 4th years) was 63 at the start of June and closed at 10 on Friday. A spread like EDU3/EDU4 settled 20.5 Friday, just off Thursday’s low-for-the-year 18.5. It was 50 at the end of September. As a contrary play, it’s worth considering buying back spreads for the positive roll (EDM3/EDM4 is 33.5). If the Fed CAN hold off on rate hikes and inflation stays high, then these spreads will rally. If the market is successful in forcing rate hikes sooner than later, back spreads will remain under pressure.

| 11/5/2021 | 11/12/2021 | chg | ||
| UST 2Y | 39.5 | 51.7 | 12.2 | |
| UST 5Y | 105.1 | 123.1 | 18.0 | |
| UST 10Y | 145.0 | 157.7 | 12.7 | |
| UST 30Y | 188.4 | 195.2 | 6.8 | |
| GERM 2Y | -72.9 | -74.2 | -1.3 | |
| GERM 10Y | -28.0 | -25.9 | 2.1 | |
| JPN 30Y | 67.1 | 67.8 | 0.7 | |
| CHINA 10Y | 289.0 | 293.6 | 4.6 | |
| EURO$ Z1/Z2 | 55.0 | 56.0 | 1.0 | |
| EURO$ Z2/Z3 | 59.0 | 62.0 | 3.0 | |
| EURO$ Z3/Z4 | 23.5 | 19.5 | -4.0 | |
| EUR | 115.52 | 114.45 | -1.07 | |
| CRUDE (active) | 81.27 | 80.79 | -0.48 | |
| SPX | 4697.53 | 4682.85 | -14.68 | -0.3% |
| VIX | 16.48 | 16.29 | -0.19 | |
https://corporatefinanceinstitute.com/resources/knowledge/economics/misery-index/

