One-yr euro$ calendars vs actual hikes
October 24, 2021 -Weekly comment
**************************************
“If you stop at general math, you’re only going to make general math money.” – Calvin Cordozar Broadus Jr. aka Snoop Dogg
“The simple mathematics of the yield curve governs the relationship between short- and long-term interest rates. Ten-year yields, for example, can be thought of as an average of ten consecutive one-year forward rates. A rise in the first-year forward rate, which correlates closely with the federal funds rate, would increase the yield on ten-year US Treasury notes even if the more-distant forward rates remain unchanged. Historically, though, even these distant forward rates have tended to rise in association with monetary policy tightening.” -Chairman Greenspan from his Feb 2005 Conundrum speech, aka The Maestro
Here’s how I started last week’s note:
“In my world, here’s what tells the story of the week: EDZ’21/EDZ’22 calendar spread rose 13.5 bps on the week from 38 to 51.5. EDZ’22/EDZ’23 was nearly unchanged, rising just 0.5 from 68.5 to 69.0. EDZ’23/EDZ’24 fell 12.5 bps from 43.5 to 31.0.”
These trends continued last week. EDZ’21/EDZ’22 calendar rose another 10.5 to 62.0. EDZ’22/EDZ’23 was the unchanged pivot, still at 69. EDZ’23/EDZ’24 fell another 3.5 to 27.5. In the space of two weeks, EDZ’21/Z’22 has risen 24 bps, forecasting an additional hike by the end of 2022. Jan’21/Jan’22 Fed Fund spread settled at 55 bps, indicating certainty of two hikes next year. But July’22/July’23 FF calendar settled 74.5, for a total of three hikes over that year.
The Fed’s narrative has changed, and the market is pressing to move the timetable up for hikes. From Powell Friday: “Supply constraints and elevated inflation are likely to last longer than previously expected and well into next year, and the same is true for pressure on wages.” “If we were to see a risk of inflation moving persistently higher, we would certainly use our tools.” The Fed has moved from saying inflation is “transitory” to claiming that “expectations are still anchored”. As SF Fed head Daly said, “raising rates now would not solve the global supply-chain issues but could start to bridle growth next year just as inflation pressures are receding, and cost the economy both output and jobs.” Rate hikes won’t solve port congestion, as the story goes.
All yields rose last week, with fives leading the way up 8.7 bps to 1.21%, but the curve flattened with bonds only up 4.2 to 2.09%. From June 2004 through the middle of 2006 the Fed hiked rates at every FOMC meeting, eight times a year. In February of 2005, Greenspan noted that long term yields had barely budged with the onset of this tightening. “For the moment, the broadly unanticipated behavior of world bond markets remains a conundrum. Bond price movements may be a short-term aberration, but it will be some time before we are able to better judge the forces underlying recent experience.”
The Fed’s first hike in 2004 was at the end of June from 1.0 to 1.25%. On June 14, just prior to the Fed’s first hike, the ten year had notched its high for the year at 4.87%. By the beginning of February 2005, the yield was 4.07%, even as the FF target had more than doubled to 2.50%. That was the conundrum. Tens didn’t exceed the 2004 high until early April of 2006, when the yield reached 4.90% as the FF target hit 4.75%. From mid 2004 to mid 2005 CPI bounced between 2.5 and 3.5%. By the end of Q3 ‘05 it had surged to 4.7%, while the ten-yr yield hovered just below that level. By the middle of 2006, as the FF target topped at 5.25%, tens had made an attempt to ‘catch-up’ to funds and CPI, also topping for the cycle at 5.25%.
But it’s not really the action of long rates that I want to focus on, but rather the predictive ability of euro$ one-year calendars to appropriately forecast the amount of Fed hiking. Currently, the peak one-year is EDU’22/EDU’23 at 83 bps, and the next highest is EDM’22/EDM’23 at 79 bps, just prior to the SOFR transition. By no means is it clear that these levels will represent the actual peak, though they are at new yearly highs.
Let’s take a look at the constant maturity 1st to 5th ED contract spread in 2004. Currently, 1st to 5th is EDZ’21/EDZ’22 at 62 bps. At the end of Q1 2004, three months prior to the actual initial hike, ED1 to ED5 was 111 to 137. This spread surged to a high of 215 on June 14; the first actual hike was June 30. The 2nd to 6th picture is much the same; it topped at a high of 191 on May 13. These spreads nailed it at the peak levels: 215 and 191 bps vs an actual 200 bps of hiking in a year. Interestingly, in Q3 2003, the 4th to 8th calendar, currently corresponding to the peak EDU’22/EDU’23 spread, topped at 187 on September 3, 2003. That spread also peaked with a more-or-less accurate forecast of actual hikes.
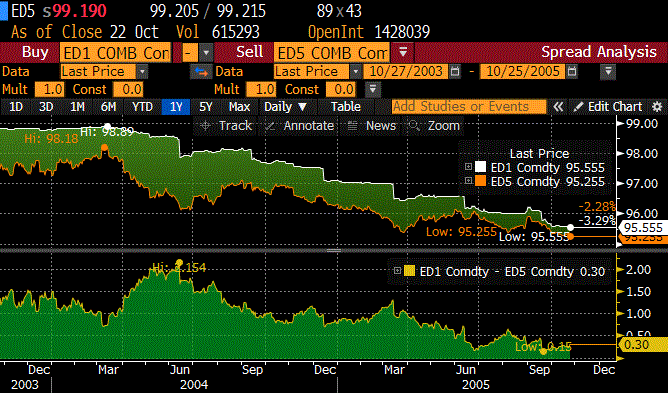
Above is ED1/ED5 (first to fifth quarterly ED spread) in 2003 to 2005
Where the spreads got it wrong is after the hiking began. By September ‘04, the 1st/5th is back down to 100, even though from September of 2004 to September 2005 there was another 200 bps of actual FF rate increases.
The 2004 to 2006 rate hike cycle lasted two years. The only cycle we’ve had since then is 2015 to 2018. For practical purposes, this was really also only a two-year cycle, as the first 25 bp step was in Dec 2015 and the next in Dec 2016. From Dec 2016 to Dec 2018 the midpoint target moved from 37.5 bps to 237.5, a total of 200 over two years. In this period CPI ranged from around 1.6% to 3%, about 50 bps lower than in mid-2004 to 2005. I would note that both ED1/ED5 and ED2/ED6 topped at about 65 just prior to the Dec 2016 hike. At that time the spreads underestimated the amount of actual annual rate hikes of 100 bps.
The differences now are that inflation is more than twice as high as it was at the start of either previous hike cycle. The initial lift-off rate is lower at 0-0.25. The current conundrum is perhaps to ask why forward Eurodollar contracts are as high as they are or, said another way, why one-year calendars aren’t higher. It’s probably the case that since the first hike isn’t expected until after taper that it’s premature for the forward spreads to be over 100 bps. However, I believe it’s the case that EDU’22/EDU’23 will surpass 100 (up another 17 from here) before it goes to 66.
In the UK the short sterling curve has inverted from 2023 contracts to 2024 as the Nov 4 meeting is in play for a hike and the near Dec’21/Dec’22 sterling spread is the peak at 79.5. In the US the back end of the dollar curve is flattening as well, though nowhere near inverted. I personally continue to look for higher rates, and for back spreads to grind higher with curve roll as time passes.
This week includes auctions of $60b 2’s on Tuesday, $61b 5’s on Wednesday and $62b 7’s on Thursday. Advance Q3 GDP is released Thursday and is expected 2.8%, though the Atlanta Fed’s GDP Now has consistently been revised lower, now standing at just 0.5%.
| 10/15/2021 | 10/22/2021 | chg | ||
| UST 2Y | 39.9 | 46.2 | 6.3 | w/I 50.0 |
| UST 5Y | 112.2 | 120.9 | 8.7 | w/i 122.7 |
| UST 10Y | 157.6 | 165.5 | 7.9 | |
| UST 30Y | 204.8 | 209.0 | 4.2 | |
| GERM 2Y | -67.7 | -63.7 | 4.0 | |
| GERM 10Y | -16.7 | -10.5 | 6.2 | |
| JPN 30Y | 68.7 | 70.6 | 1.9 | |
| CHINA 10Y | 298.9 | 299.6 | 0.7 | |
| EURO$ Z1/Z2 | 51.5 | 62.0 | 10.5 | |
| EURO$ Z2/Z3 | 69.0 | 69.0 | 0.0 | |
| EURO$ Z3/Z4 | 31.0 | 27.5 | -3.5 | |
| EUR | 115.99 | 116.47 | 0.48 | |
| CRUDE (active) | 81.73 | 83.76 | 2.03 | |
| SPX | 4471.37 | 4544.90 | 73.53 | 1.6% |
| VIX | 16.30 | 15.43 | -0.87 | |
https://www.federalreserve.gov/boarddocs/hh/2005/february/testimony.htm

