Borrow and Invest
July 25, 2021 – Weekly Comment
Coffee prices exploded higher last week on a frost in Brazil. On June 30, KCU1 settled 159.75. On Friday, the high was 209.50, with a settlement at 189.00. I was chatting with a friend in NY about this price action, and he mentioned that his daily afternoon latte was running $6.77 with tax and tip. I don’t know how much of that is the price of coffee beans, but I did mention that at a 30-year mortgage rate of 2.75%, that expenditure of around $140/month would cover $35,000 of a mortgage. Which is enough to buy this 1.3 acre lot in Prairie du Chien, WI, where you can build your dream cabin off the grid. And get a dog. And chat with Floyd down at the barbershop. And Juanita at the coffee shop.
https://www.realtor.com/realestateandhomes-detail/Velvet-Ln_Prairie-Du-Chien_WI_53821_M74635-06979
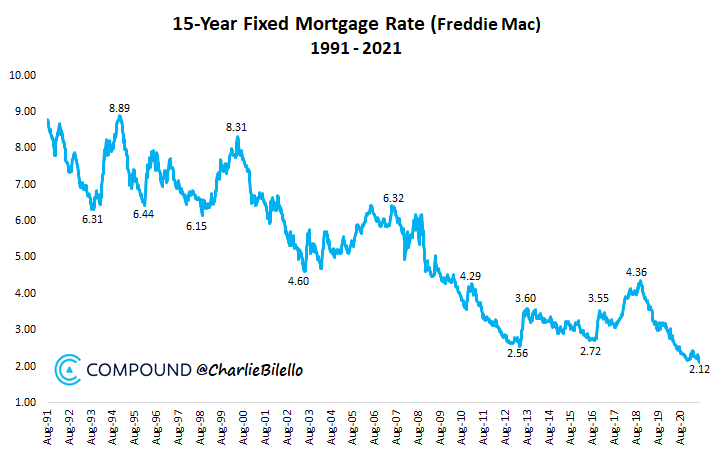
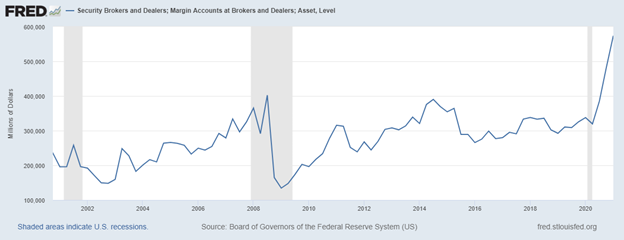
Here’s a chart of the 15 year mortgage rate. It’s difficult to understand why the Fed continues to buy $40 billion per month in MBS, but it’s easy to see why real estate values are levitating. The FOMC meeting this week (announcement and press conference on Wednesday) will consider trimming the pace of asset purchases. Of course, the balance sheet will still be growing, unlike the episode in 2018 when the balance sheet level actually declined until the infamous Q4 2018 stock market sell-off caused an embarrassing re-think. For now, the music is playing, and it is compelling to be a borrower and ‘investor’ of sorts. A headline in the FT says “Combined value of loans made by wealth management units at top US banks in the second quarter exceeds $600bn.” I’m not sure when ‘wealth management’ units rally started proliferating, but I would bet their rise correlates strongly with Fed accommodation. In any case, while the Fed’s stated purpose in keeping funding rates at zero is to regain maximum employment (with an unemployment rate of 3.5%), the subtext is “ADD LEVERAGE”. That message has been clearly embraced by margin investors as the chart below on “Margin Accounts at Brokers and Dealers” shows. In 2018 Margin accounts were about $330 billion. In the aftermath of Covid they have surged to $580 billion.
It’s no wonder that the Fed wants to tiptoe very gently into discussions of removing accommodation, because if their actions have juiced asset values, then the reaction to any sort of restraint could pose problems. Already there are signs of trepidation. While MSFT and FB surged to new highs at the end of last week, a Reuters article notes: “Fewer than half of the stocks in the S&P recently traded above their 50-day moving averages even as the index has been at or near new highs, compared to over 90% in April, a sign that ‘what is happening beneath the surface is at odds with the picture of strength that is portrayed if one just looks at the popular averages,’ according to Willie Delwiche…”
Of course, this week it’s about the titans. Earnings reports:
Monday: TSLA
Tuesday: AAPL, GOOGL, MSFT, V
Wednesday: FB
Thursday: AMZN
Friday: XOM
I would note that Visa (V) also surged at the end of last week to a new all-time high close. It’s also worth mention that AAPL, AMZN, GOOGL, FB and MSFT make up 1/4 of the S&P 500 market cap. FB now sports a market cap above $1 trillion for the first time! Exxon, on the other hand, trades below the 50 and 100 DMAs and, as of Friday, is nearly 12% off the high price set in June.
I do hold the view that commodity prices are indicative of inflation, whether one looks at coffee, oats, natural gas, crude oil, soybean oil, coal, etc. However, I can also accept the transitory argument, in part because the rate of change in the prices of a lot of commodities which have surged will almost inevitably slow. Over the medium term, the data is likely to reflect higher inflation from rents. And, as Mohamed El-Erian said in an interview on Friday, the Fed does not seem to appreciate what is happening at the “company level”, where many companies have raised prices and seen them stick and now intend to boost prices further. On the disconnect with bond prices, he said one must respect the fact that a completely price-insensitive buyer of $120 billion per month is holding yields down.
OTHER MARKET THOUGHTS/TRADES
On the week, the US ten-year yield fell 1.4 bps to 128.5, while fives fell just over 6 bps to 71.7. This week Treasury auctions 2, 5 and 7 year notes on Monday, Tuesday and Thursday, with the FOMC outcome on Wednesday.
Last week I suggested fading the flattening from greens to blues, and looked at an idea like selling 2EZ 9850/9825ps (2.75s) vs buy 3EZ 9825/9800ps (4.25s). This settled 1.5 vs 9909.0 in EDZ3 and 3.75 vs 9871.5 in EDZ4. In fact, EDZ23/EDZ24 spread actually rallied from 33.5 to 37.5 on the week, while the one-year spread in front, EDZ22/EDZ23 declined from 56 to 48.5. On the week there was consistent buying of blue midcurve puts. As an example, 3EZ1 9837.5 puts added 70k in open interest on outright buying from 9.5 to 12.0; settled 10.25 ref 9871.5 in EDZ’24.
While my idea last week of selling EDZ3 at 9898.5 was an instantaneous loser on Monday, the more risk averse way to play for back end steepening by buying midcurve puts remains a valid strategy. Powell is likely to maintain his accommodative rhetoric at the press conference. It was after the June FOMC with it’s surprisingly hawkish dot plot that accentuated flattening from greens back, as the Eurodollar curve moved forward the perception of rate hike prospects by shifting selling pressure to the last reds and greens as opposed to further out blues and golds. There is no do plot this time; that only occurs at quarterly meetings. If Powell doubles down on accommodative talk, back end spreads will likely steepen again.
Gold has been rangebound this year and is pretty much at the midpoint between 1700 and 1900. It seems to have lost its safety bid. The chart above shows SPX priced in gold, with this area being important in terms of a possible upside breakout. A failure in stocks, perhaps due to earnings disappointments, may restore relative luster to gold.
| 7/16/2021 | 7/23/2021 | chg | ||
| UST 2Y | 22.4 | 19.8 | -2.6 | w/I 21.7 |
| UST 5Y | 77.8 | 71.7 | -6.1 | w/I 73.2 |
| UST 10Y | 129.9 | 128.5 | -1.4 | |
| UST 30Y | 193.1 | 192.4 | -0.7 | |
| GERM 2Y | -68.4 | -72.5 | -4.1 | |
| GERM 10Y | -35.3 | -42.0 | -6.7 | |
| JPN 30Y | 64.0 | 65.4 | 1.4 | |
| CHINA 10Y | 294.8 | 291.2 | -3.6 | |
| EURO$ U1/U2 | 20.0 | 16.5 | -3.5 | |
| EURO$ U2/U3 | 59.5 | 51.0 | -8.5 | |
| EURO$ U3/U4 | 37.5 | 39.0 | 1.5 | |
| EUR | 118.06 | 117.73 | -0.33 | |
| CRUDE (active) | 71.56 | 72.07 | 0.51 | |
| SPX | 4327.16 | 4411.79 | 84.63 | 2.0% |
| VIX | 18.45 | 17.20 | -1.25 | |

